Appearance
Artboard list
One row per item of a list: a results table, a ticker, a set of names. You design one row as an artboard; the list draws it once for each item the data holds.
Select a layout and press Artboard list in its inspector, or right-click the layout in the Hierarchy and choose Add artboard list. The list goes inside the layout, which flows its rows.
What it does
| Row | What it does |
|---|---|
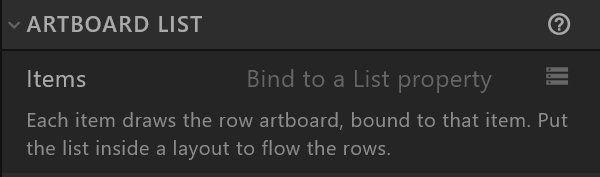
| Items | The list it draws. Bind it with its diamond to a List property in the Data panel. Until then it reads "Bind to a List property" |
| Row artboard | Once bound: which artboard each item is drawn with. Automatic (name) uses the one the list finds first among the artboards whose view model is the item view model; pick another when several artboards use it, such as a normal row and a highlighted one. With none yet, it warns: "No artboard uses the item view model yet — add one and set its view model" |
| Row size | How big each row is: a size in pixels, a percentage, or auto for each direction, and a scale. It starts at 200 × 60. When that is smaller than the row artboard, the panel says so — "Rows are drawn at 200 × 60; Result row is 1100 × 84, so each row is cut off." — and Use the size of row artboard makes them match, in one step |
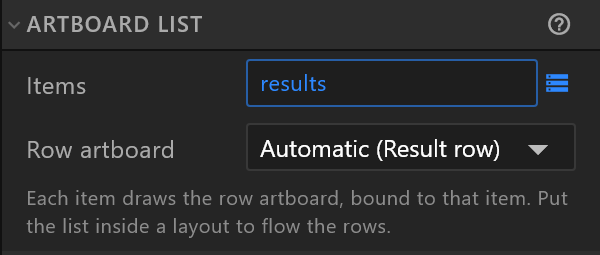
Each item is drawn with its row artboard, and that row shows the item's own values: the third result's row shows the third result.
Use it
- In the Data panel, make a view model for one item — say Result, with name and votes — and a List property of Result items on the main view model.
- Make an artboard for one row, and set its view model to Result in its Data section. Bind its texts to name and votes.
- Back on the main artboard, add a layout and an artboard list inside it.
- Bind the list's Items to the List property. Rows names your row artboard, and the rows appear.
When the control system sends five results, five rows are drawn; when it sends eight, eight are.