Appearance
Panel examples
Complete operator panels, built step by step, that you can copy for your own graphics.
Each example says what the operator does on air, what the data looks like, and how the panel is built: its controls, then its logic. The names and numbers in them are made up.
Election results by district
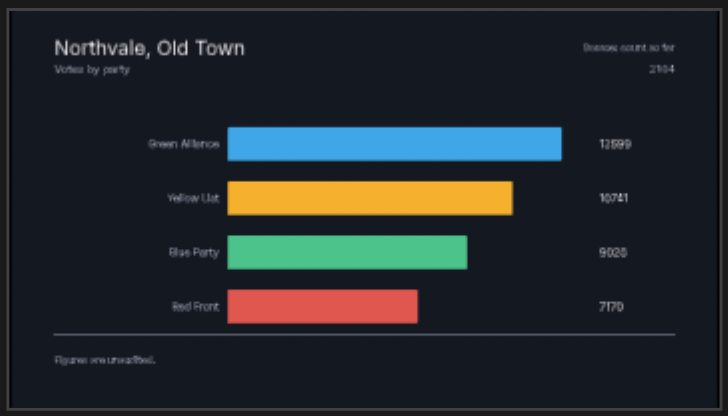
The operator chooses a city, then one of its districts; the bar chart shows that district's parties and votes, highest first, under the title "City, District".
The data
One table, results, in a spreadsheet or database file, with a row for each party in each district:
| city_id | city | district_id | district | party | votes |
|---|---|---|---|---|---|
| 1 | Northvale | 12 | Old Town | Green Alliance | 12599 |
| 1 | Northvale | 12 | Old Town | Yellow List | 10741 |
| … |
Each city and district has an id as well as a name. The lists send the ids to each other, and show the names.
The controls
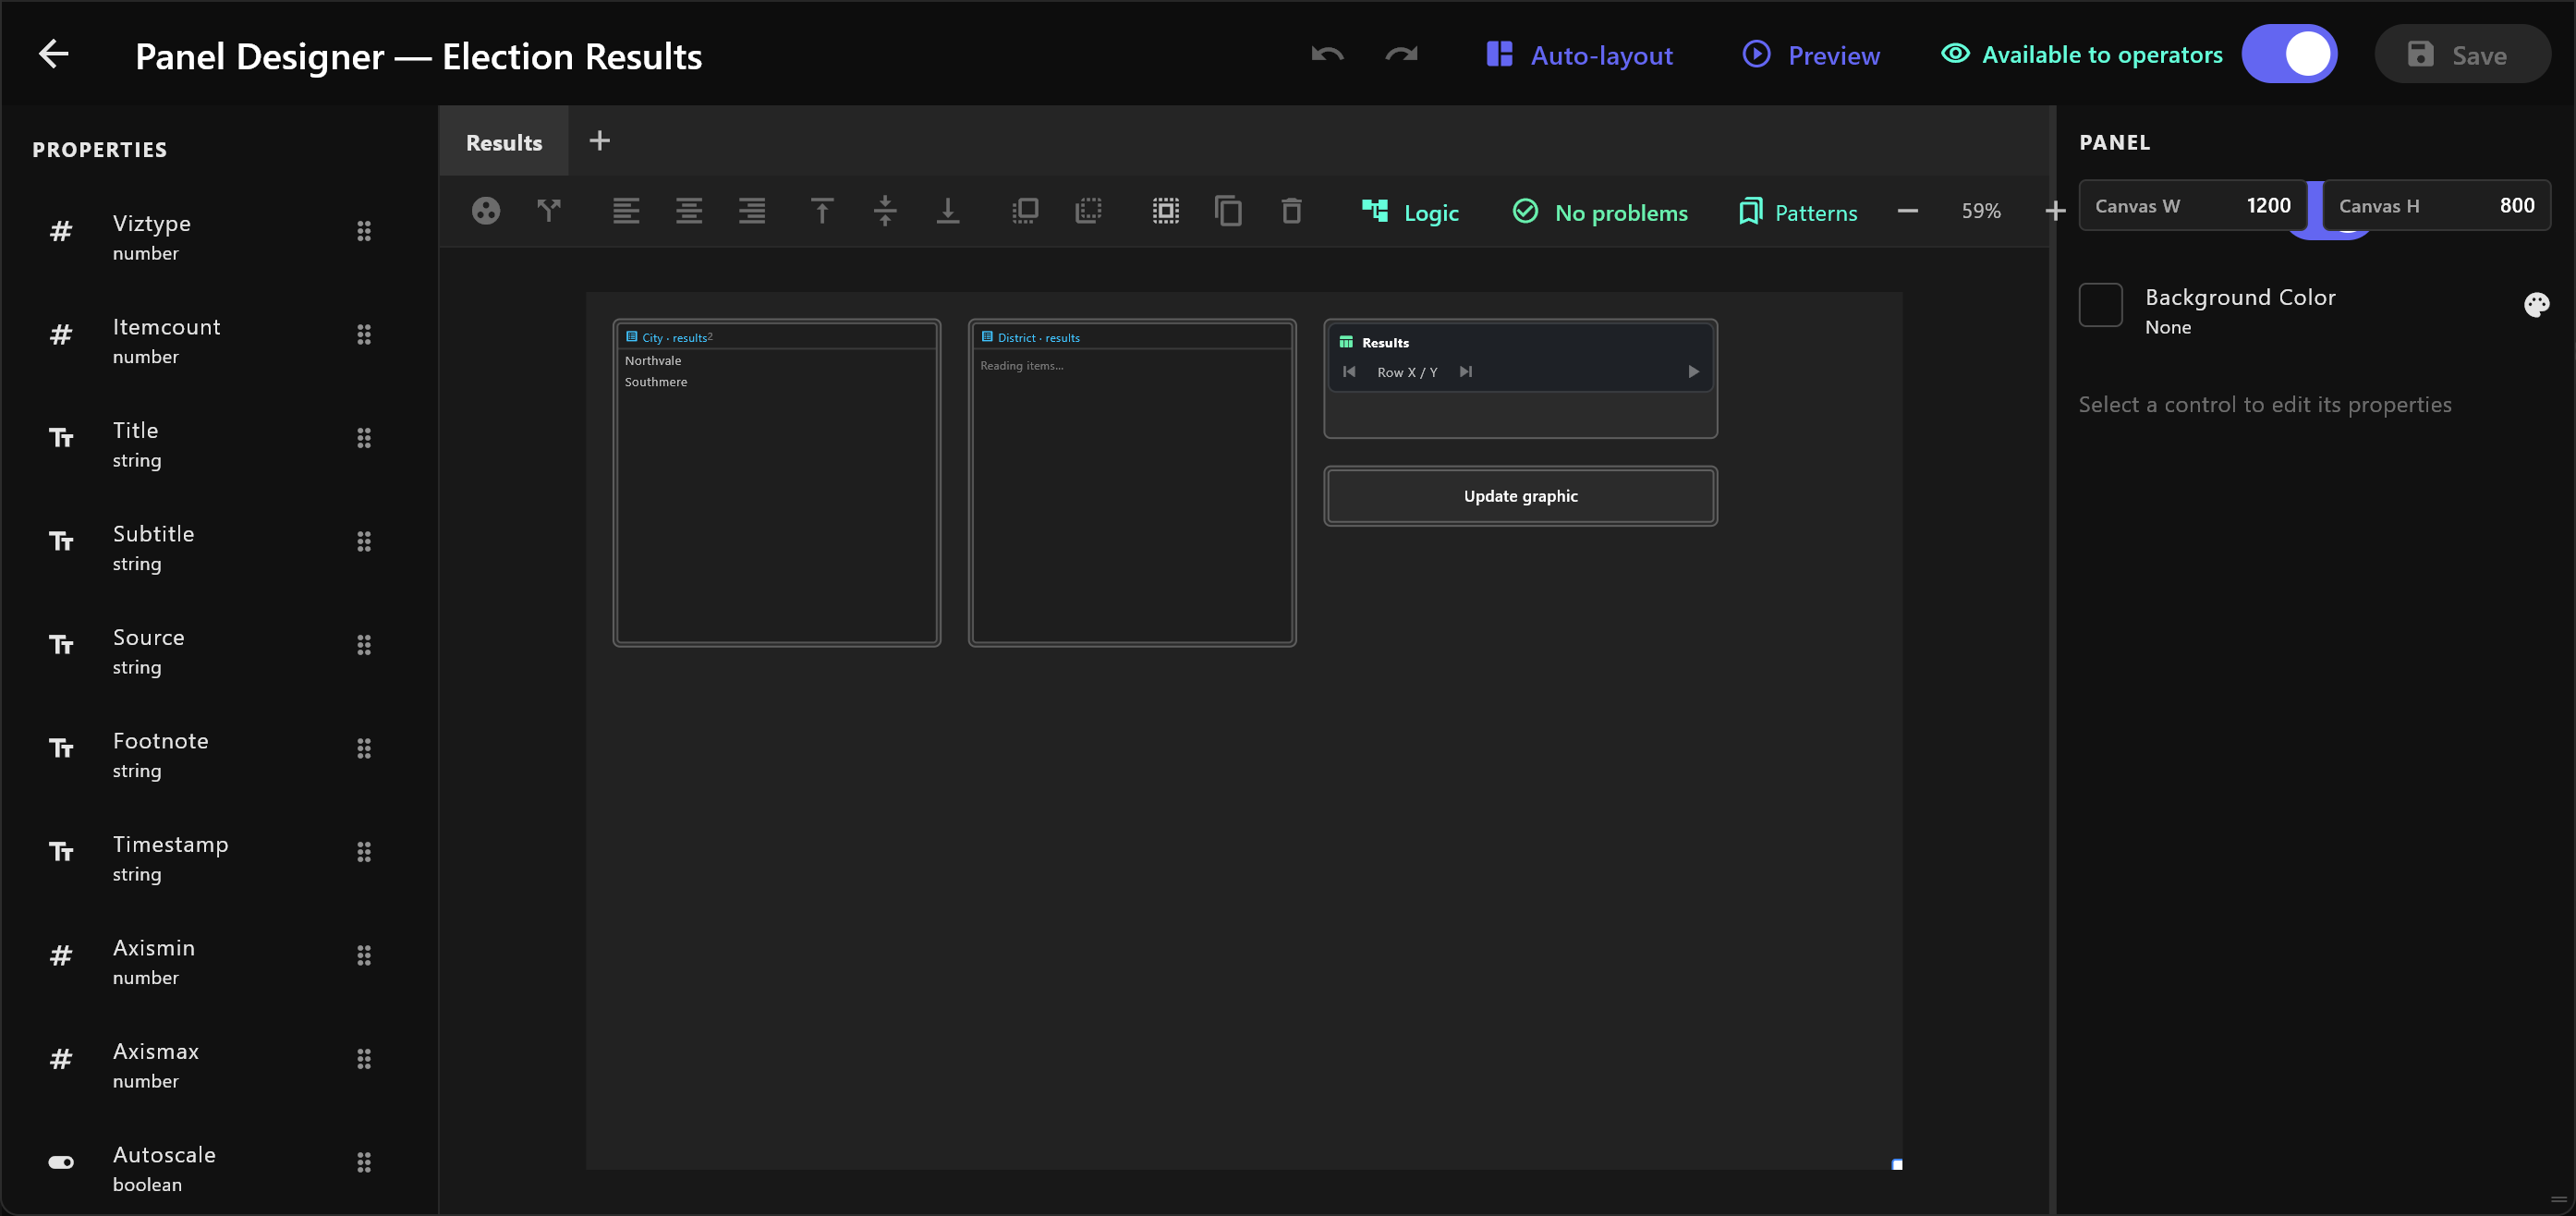
Open the chart's details and select Design Operator Panel. Add:
| Control | How to set it |
|---|---|
| List, label City | From data source on. Choose Source...: the file, table results. Show (label) city, Send (value) city_id, Hide duplicates on, Sort by ascending. |
| List, label District | The same source. Show (label) district, Send (value) district_id, Hide duplicates on. Filter by city_id. |
| Database, label Results | The same source, sorted by votes, highest first. Filter by district_id. Rows At Once 4: one row for each bar. |
| Button | From PROPERTIES, the chart's update trigger. Label it Update graphic. |
Hide duplicates matters here: without it, the City list shows each city once for every row of the table.
The logic
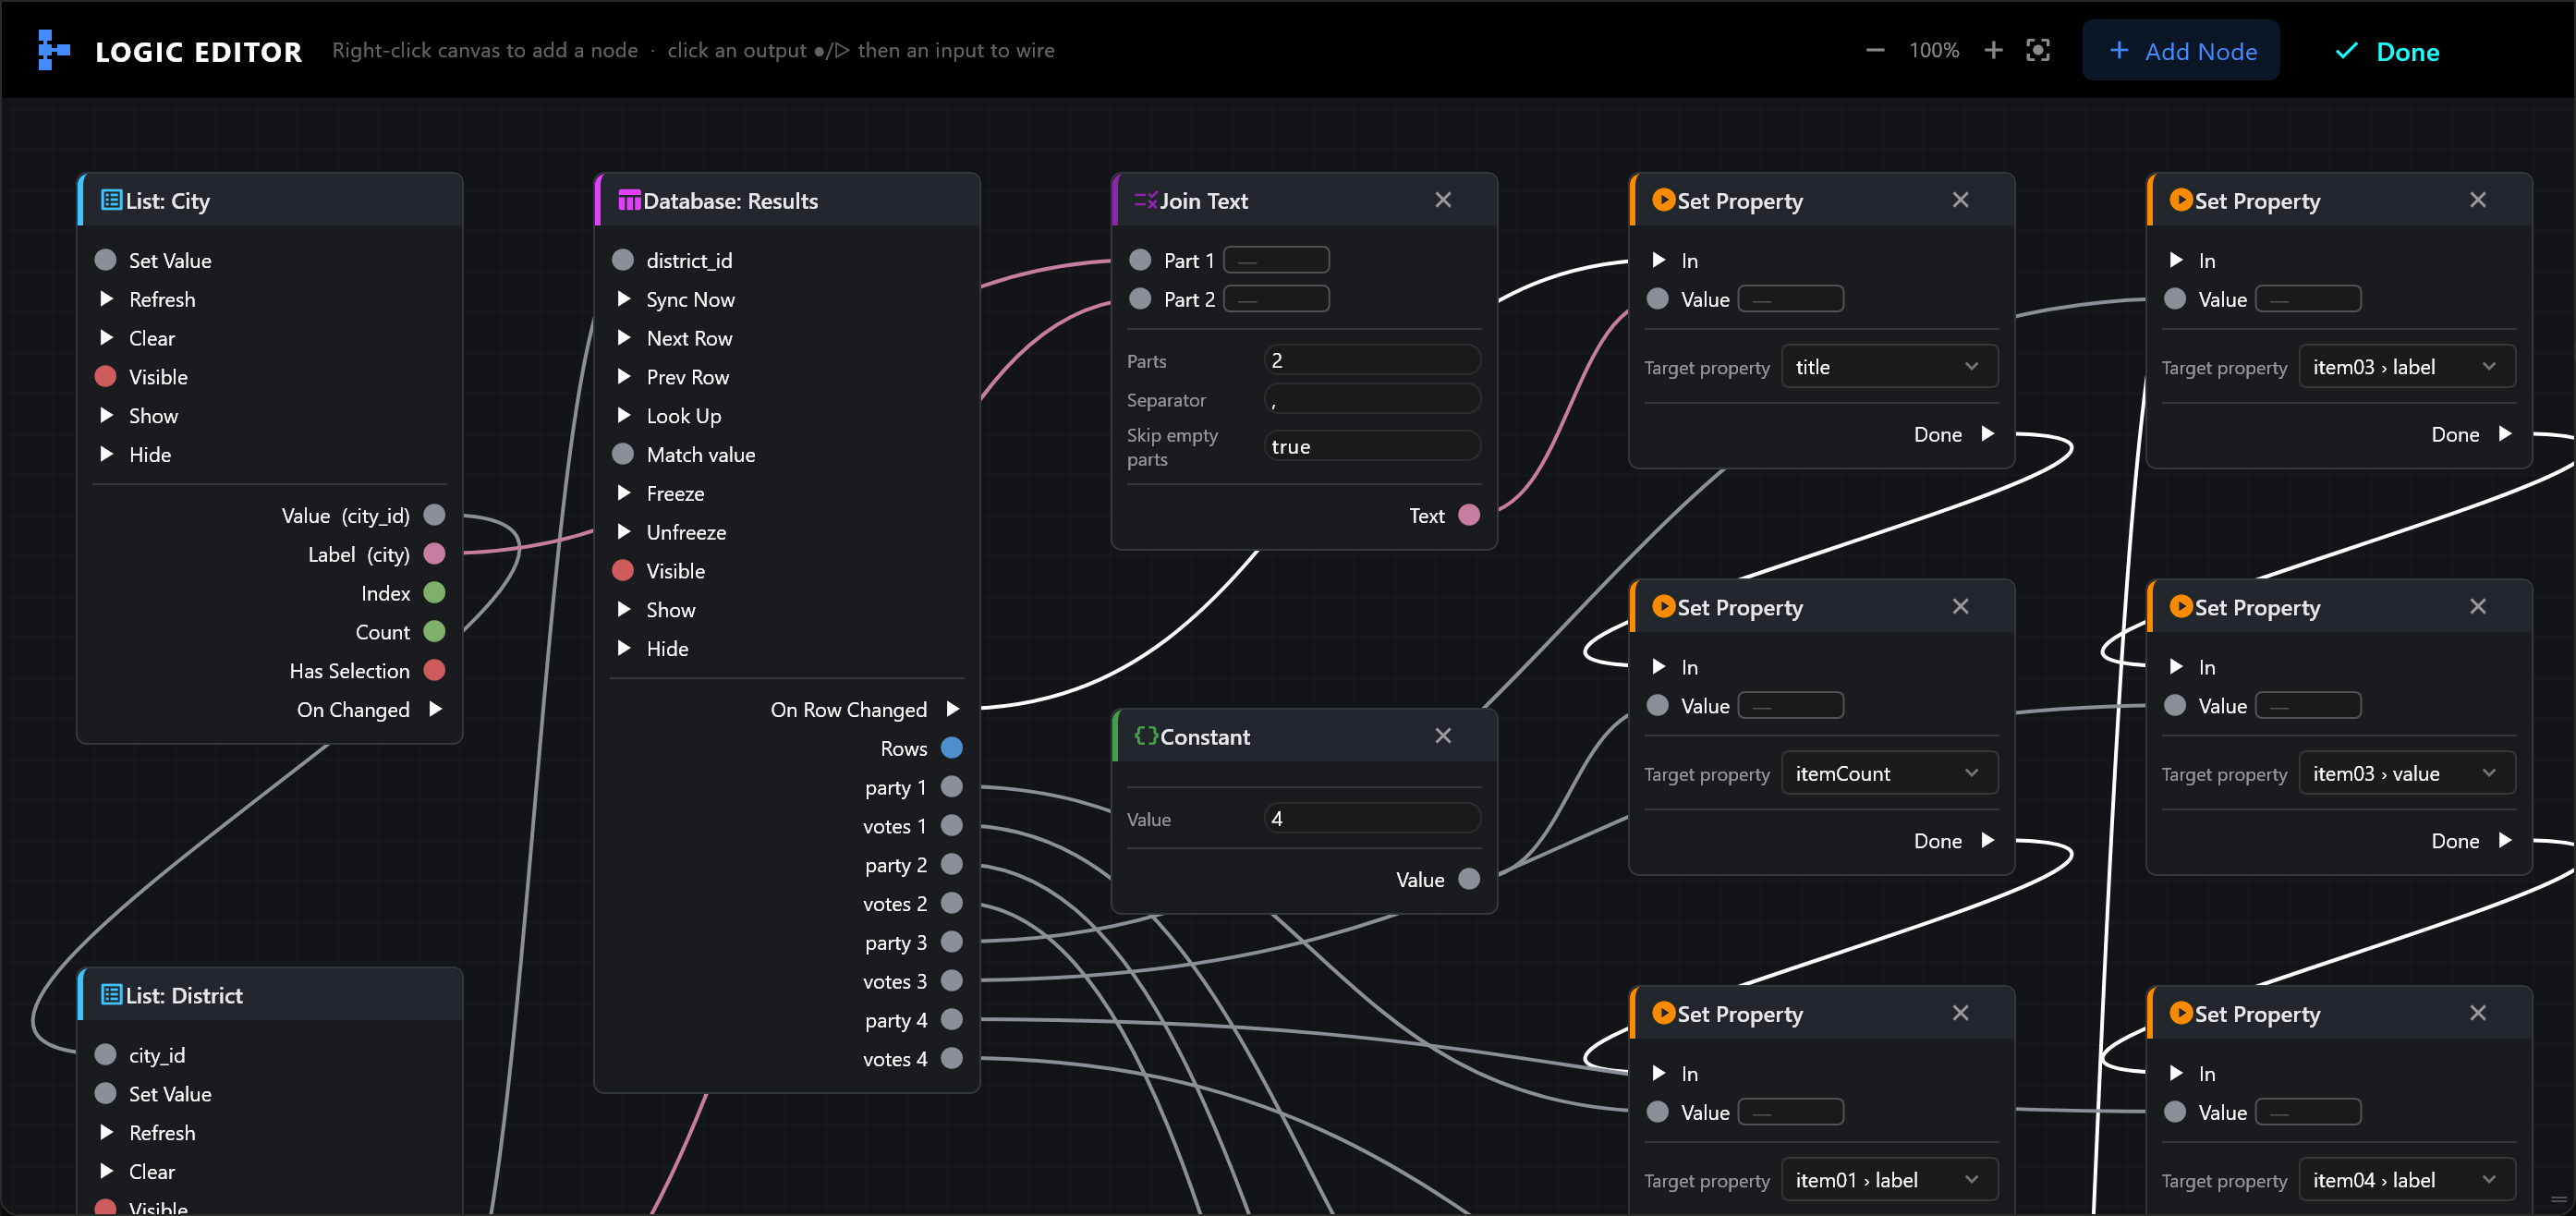
Select Logic and wire:
- City › Value into District › city_id, and District › Value into Results › district_id. Choosing a city now narrows the districts; choosing a district reads its four rows.
- A Join Text with Separator
,: City › Label into Part 1, District › Label into Part 2. Its Text goes into a Set Property whose target istitle. - A Constant
4into a Set Property foritemCount, so the chart shows four bars. - One Set Property per bar value:
item01 › labeltakes party 1,item01 › valuetakes votes 1, and so on toitem04 › value. - The steps: Results › On Row Changed into the first Set Property's In, then each Done into the next one's In.
Wire the lists' Value, not their Label, into the filters: ids match the table exactly, names may not. The panel check warns if a filter is fed by a Label. With everything wired, it reads No problems.
Turn on Available to operators and Save.
On air
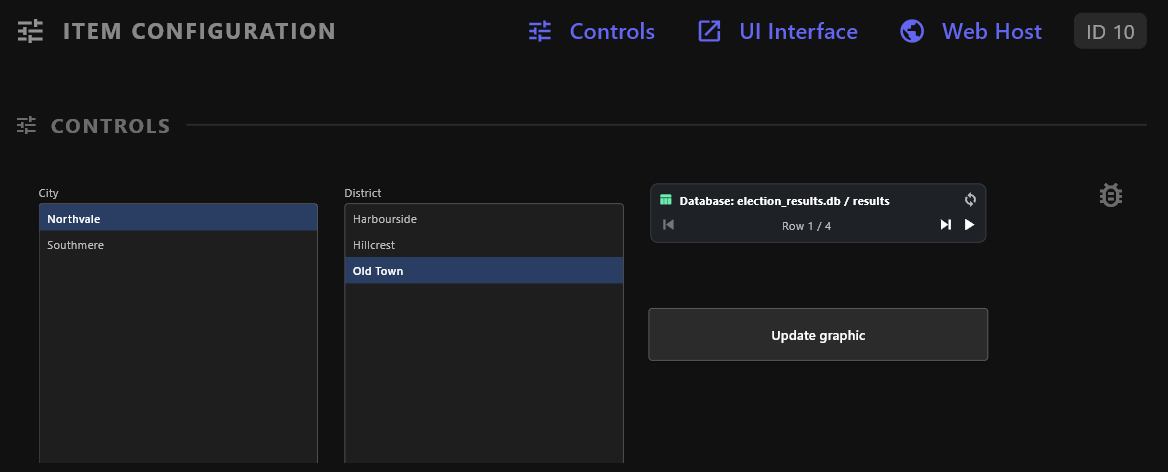
Select an item made from the chart. Its panel opens on the city and district chosen last, and reads the table again, so the votes are the latest.
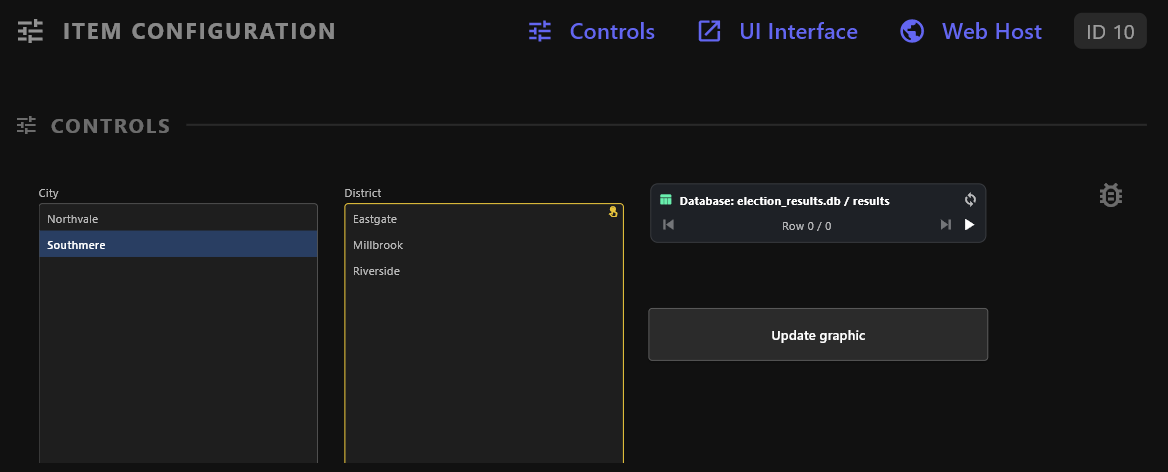
Choose another city, and the District list empties and asks for a choice. Until you choose, the chart keeps the last district's results.

The item's row in the rundown says CHOOSE BEFORE AIR, even with the panel closed.
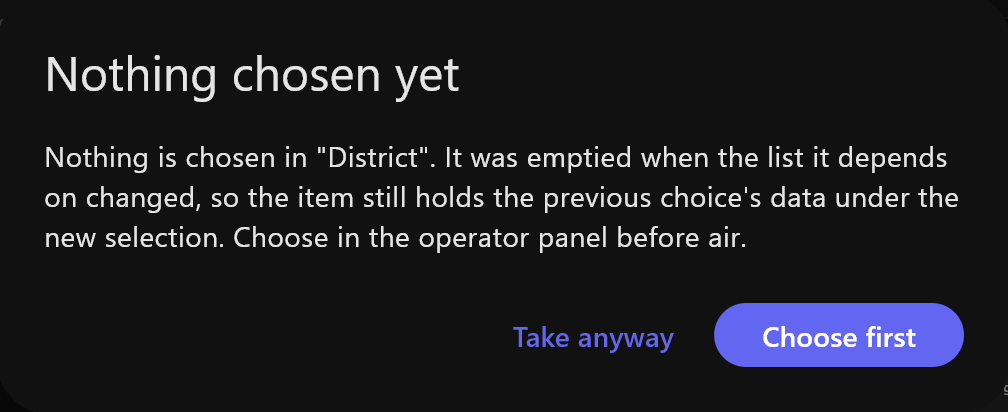
Taking it in then asks first: Choose first is the default, so Enter or Esc takes nothing. Choose a district before taking it to air.
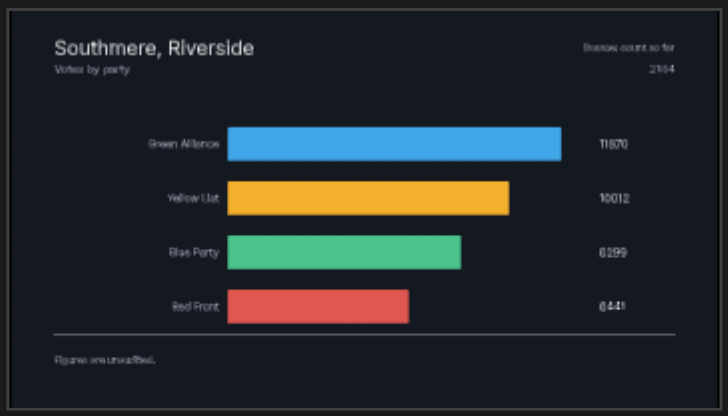
Choose the district, and the title and bars change. TAKE plays what the preview shows; on air, Update graphic plays the chart's update animation with the new numbers. Whether a change goes to air at once depends on the panel's mode: see Staged, On Air and Armed.
Countdown with a clock
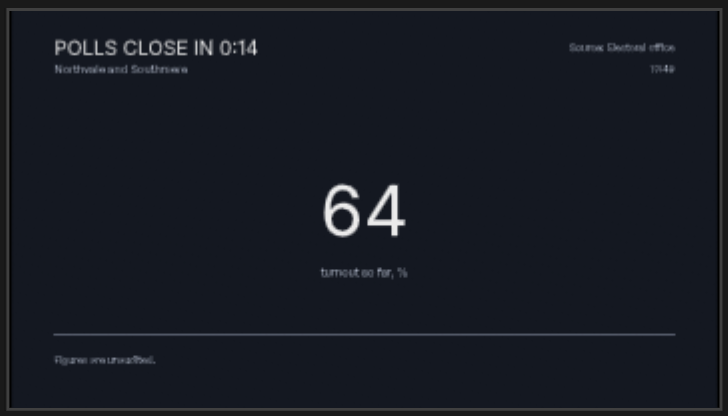
The title counts down to the close of polls, and changes by itself at zero; the time on the graphic follows the clock. The big figure shows turnout, set on the item as usual.
The controls
| Control | How to set it |
|---|---|
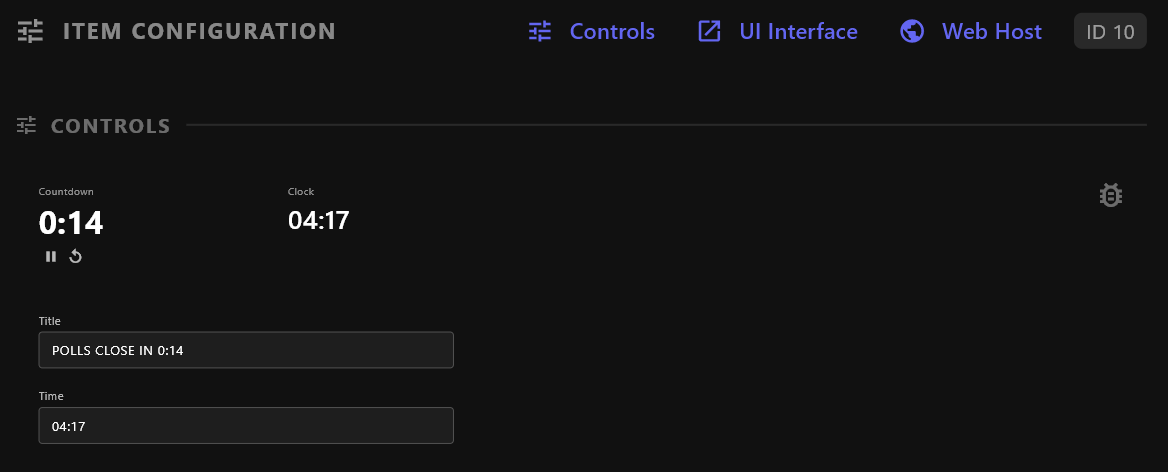
| Timer, label Countdown | Direction Count down, Start (sec) the time left (1800 for 30 minutes), Target (sec) 0, Format mm:ss, Show buttons on. |
| Clock | Format HH:mm. |
| Text, from PROPERTIES › Title | The graphic's title. The logic fills it. |
| Text, from PROPERTIES › Timestamp, label Time | The time on the graphic. The logic fills it. |
The timer's buttons start, pause and reset it.
The logic
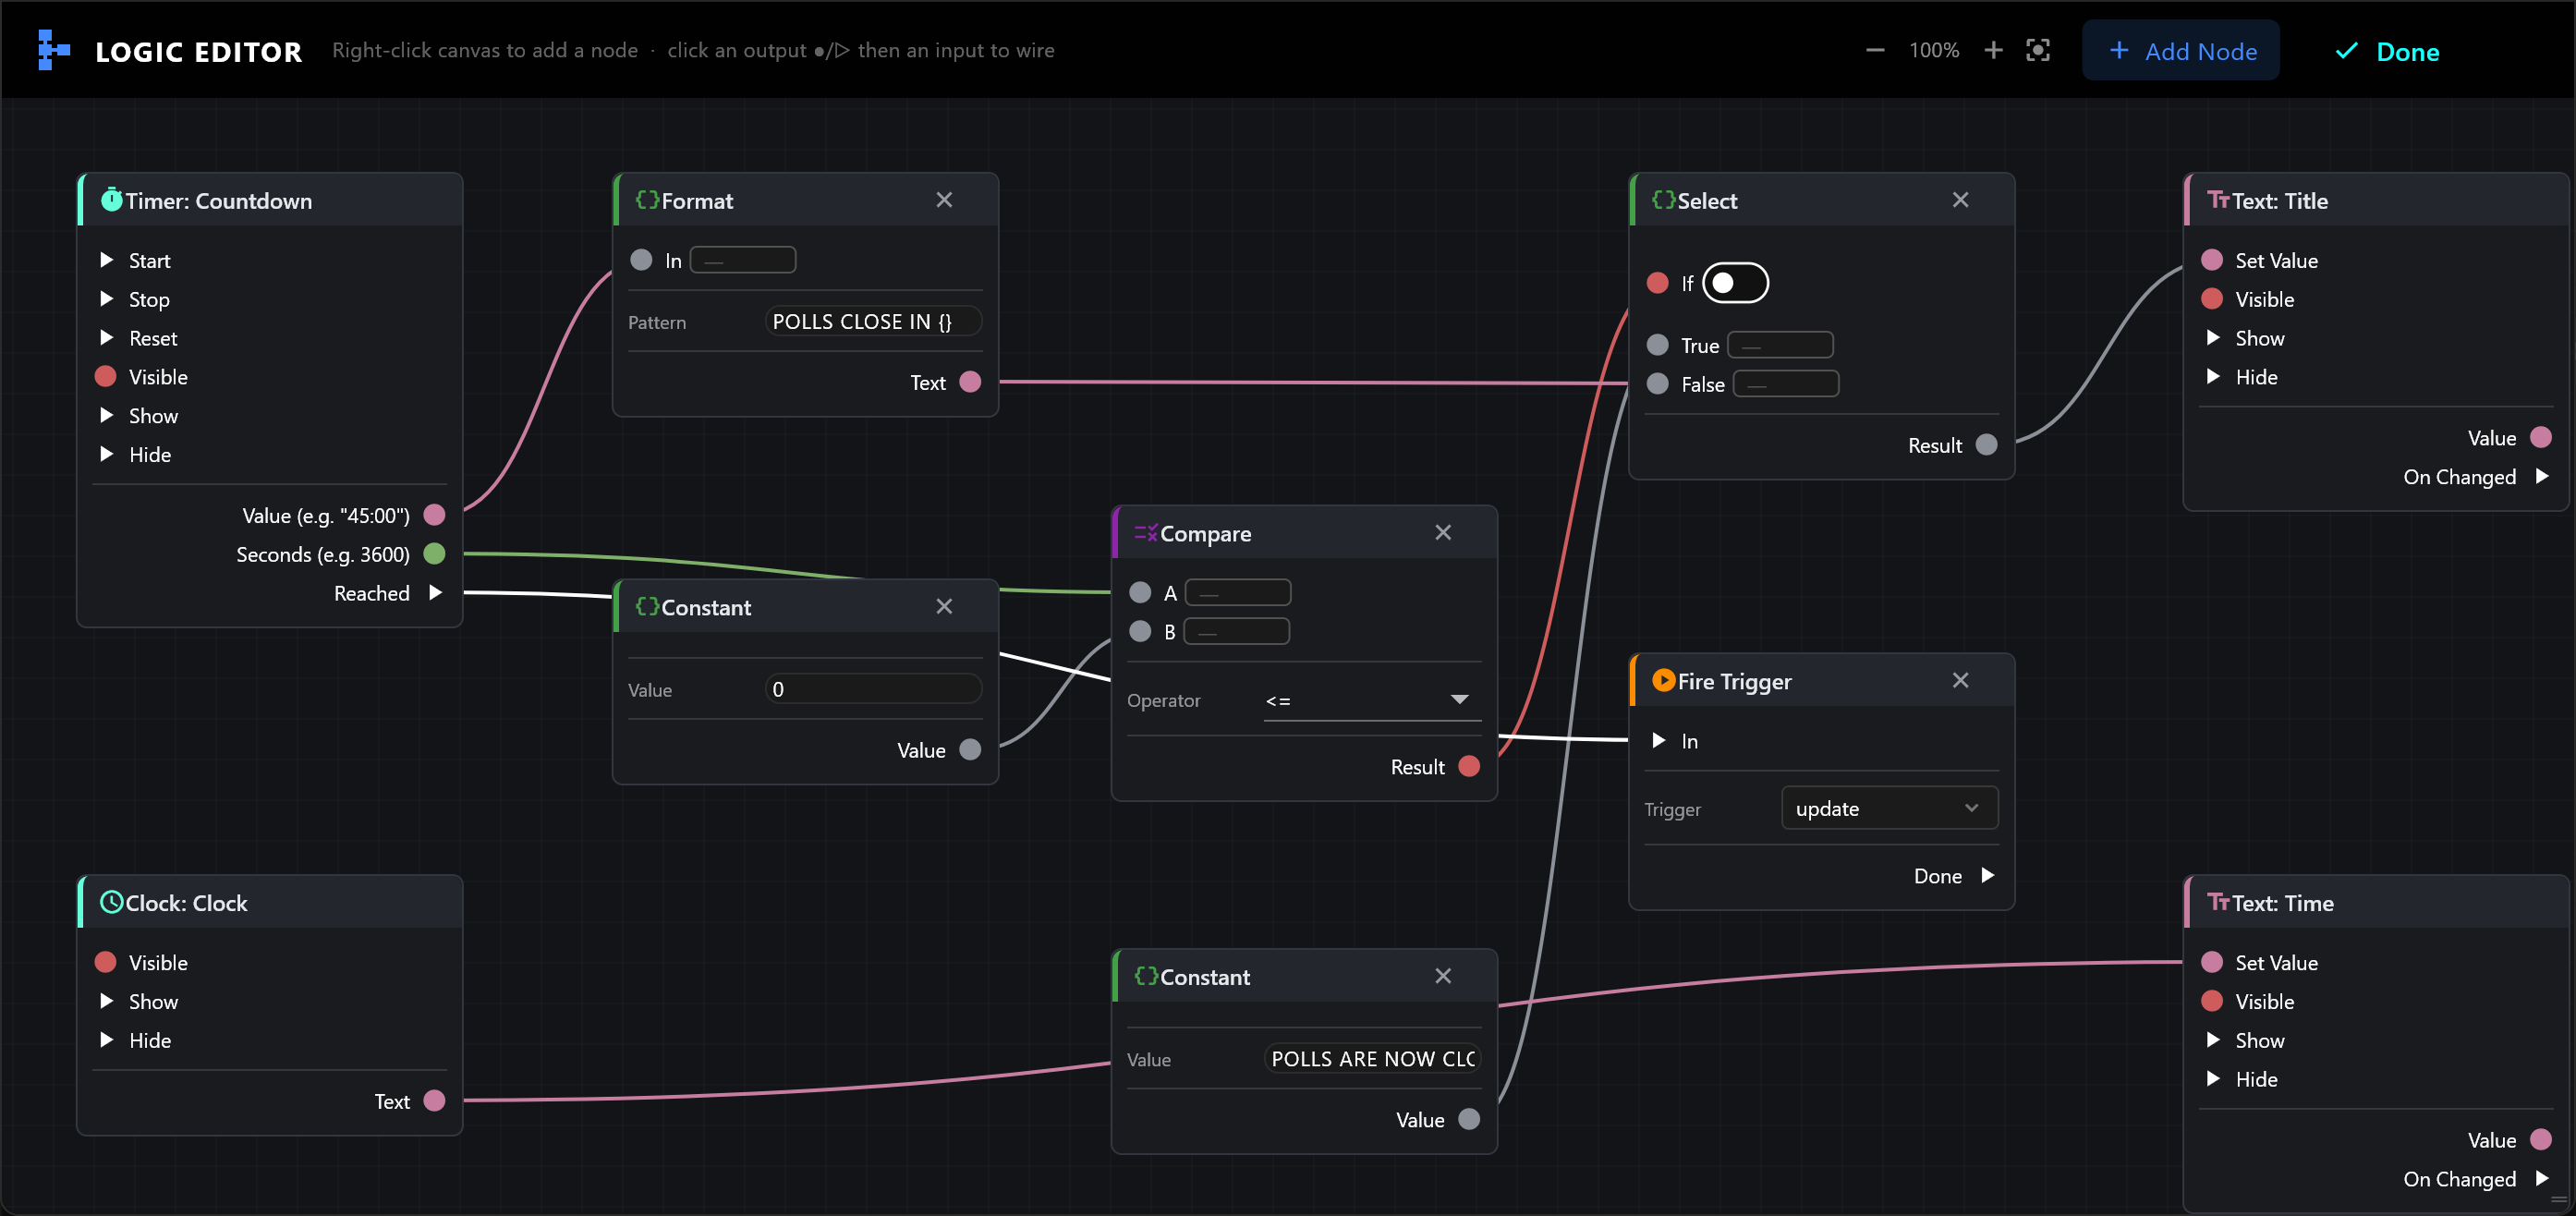
- Countdown › Value (such as
14:59) into a Format with PatternPOLLS CLOSE IN {}. - Countdown › Seconds into A of a Compare with Operator
<=, and a Constant0into its B: true once time is up. - A Select: the Compare's Result into If, a Constant
POLLS ARE NOW CLOSEDinto True, the Format's Text into False. Its Result into Title › Set Value. - Clock › Text into Time › Set Value.
- Countdown › Reached into a Fire Trigger for
update, so the new title plays in when time is up.
A wire into a control's Set Value keeps it following: the title changes every second without any step wired.
On air
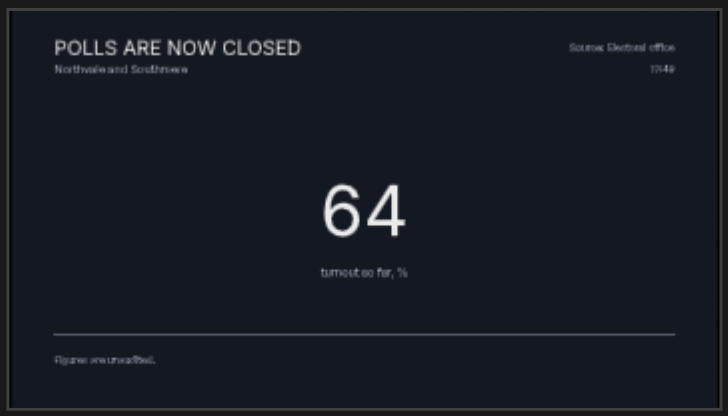
Take the item in, then start the timer with its play button. At zero the title changes and the update animation plays.
Weather round-up
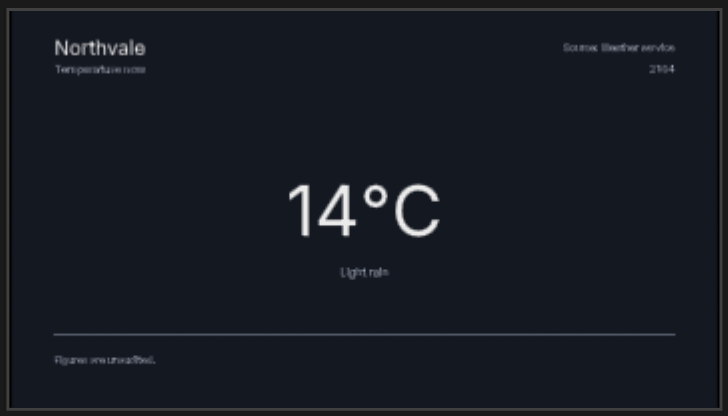
The graphic steps through the cities by itself, one every few seconds, each with its temperature and conditions.
The data
One table, weather: city, temperature, conditions, a row per city.
The controls
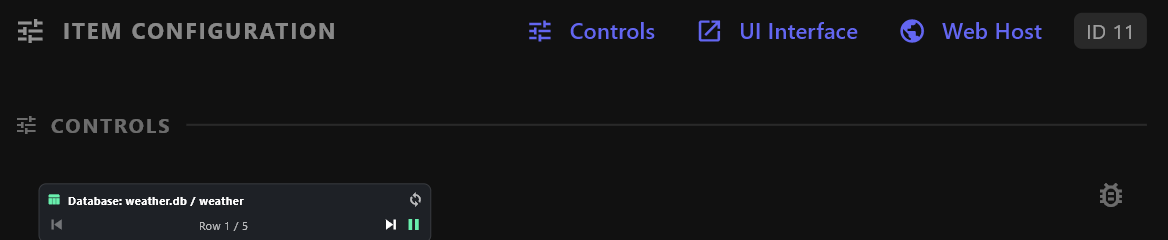
One Database, label Cities: the table, Rows At Once 1, Auto-Advance Interval (s) 6, Auto-Start Carousel on.
On the item, Unitsuffix is °C, so the figure reads 14°C.
The logic
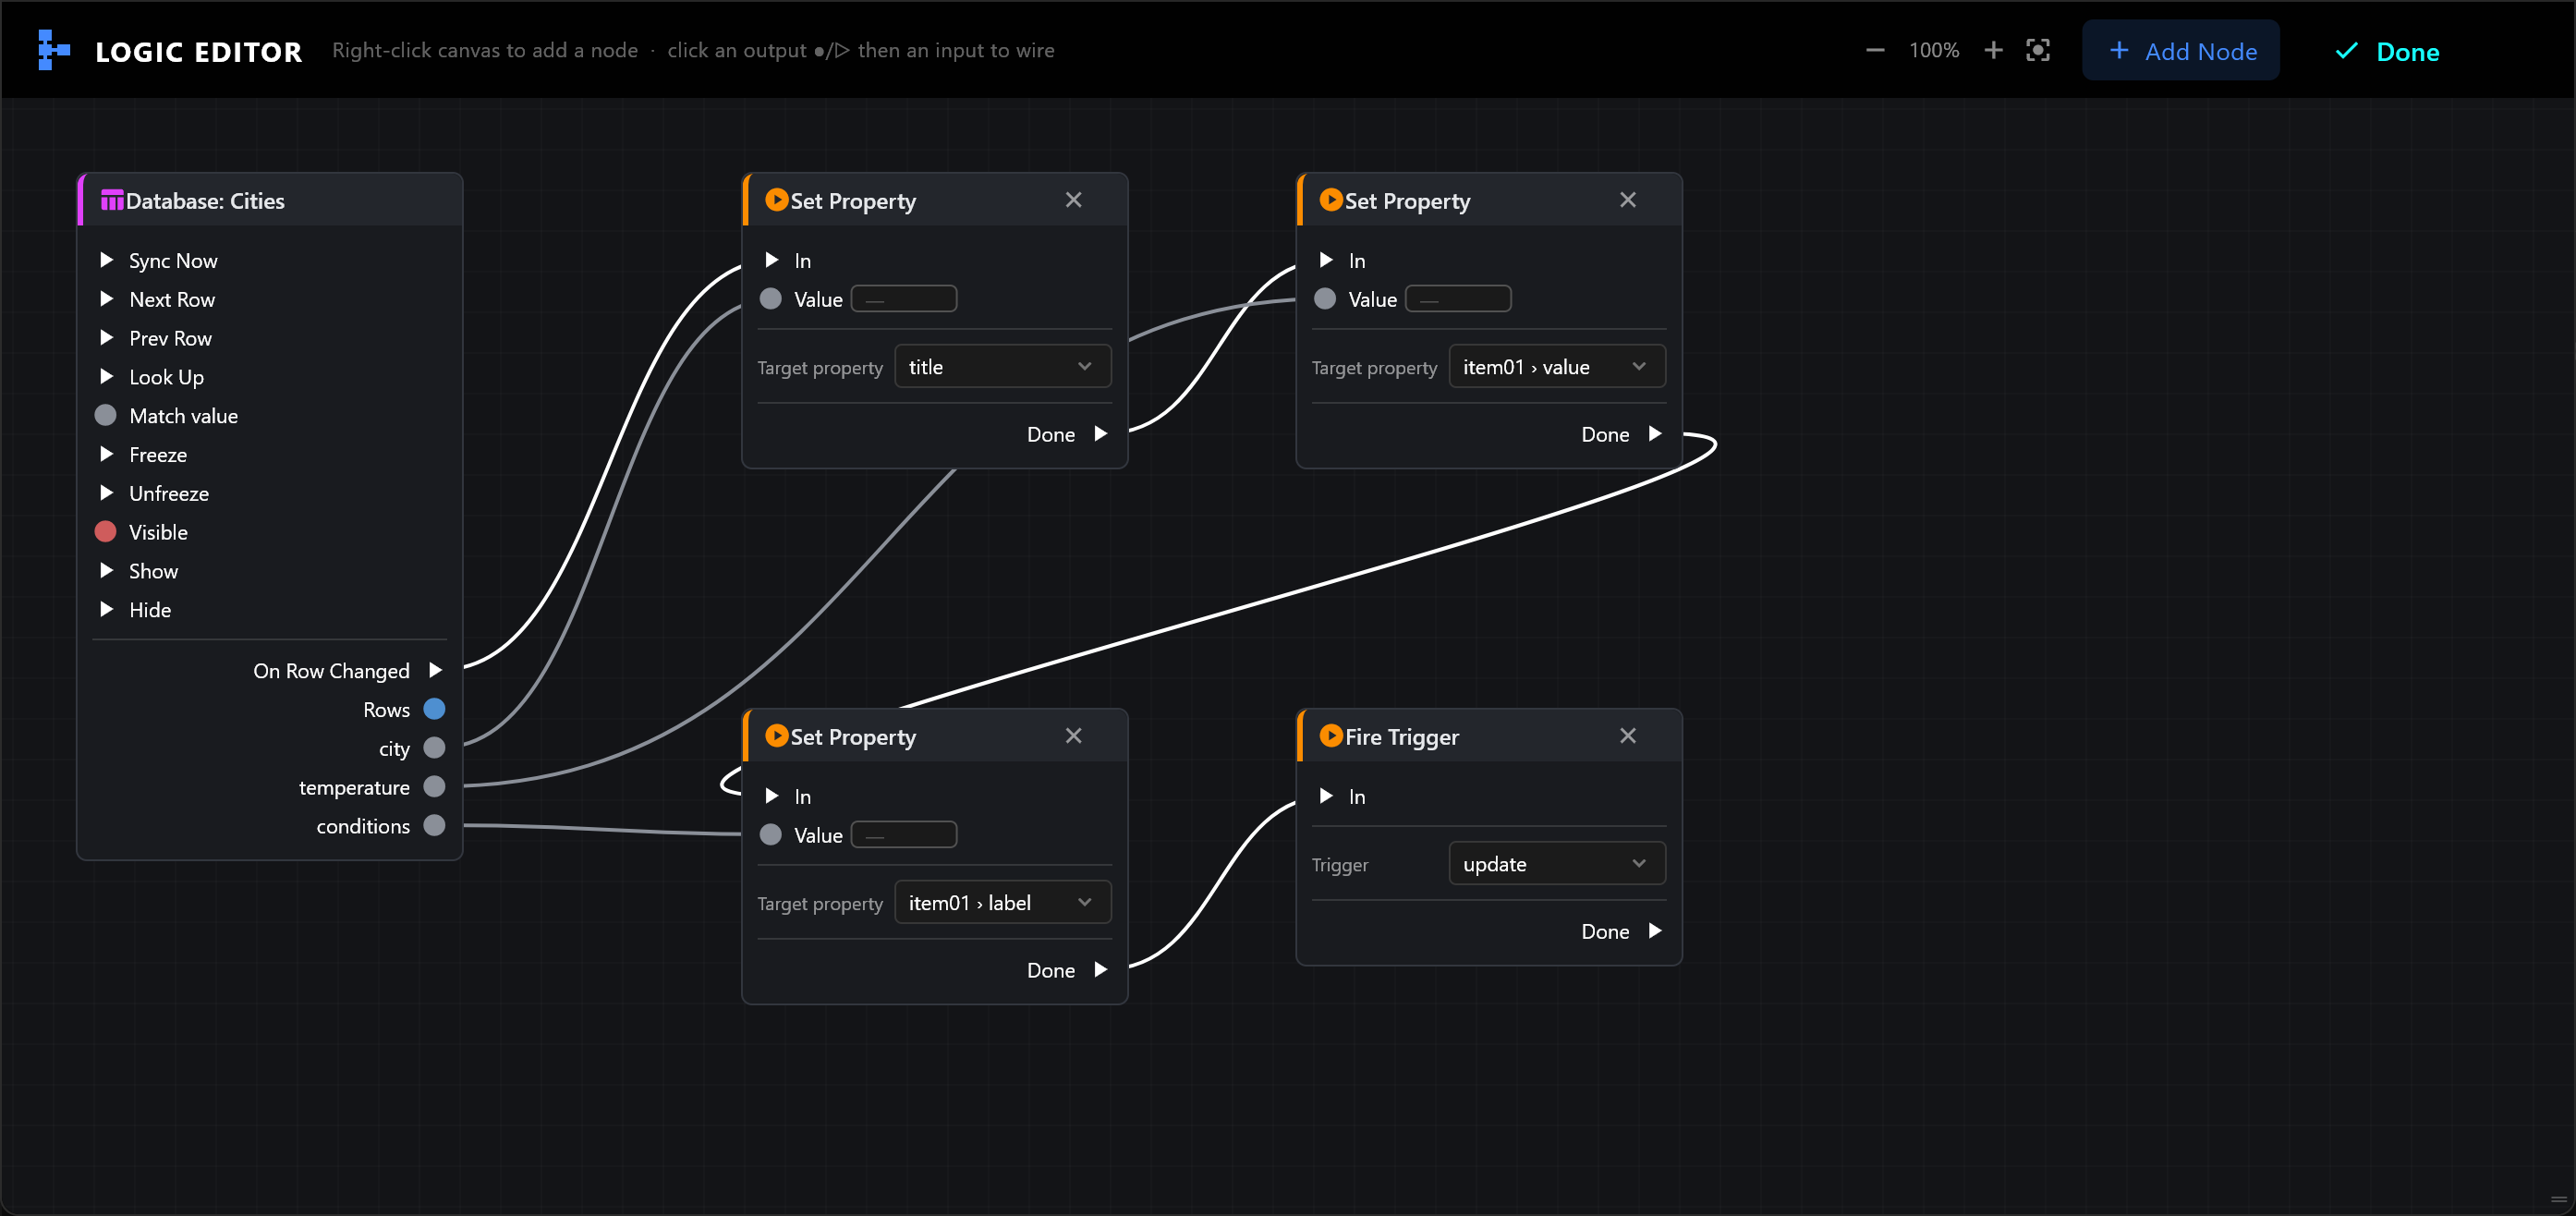
- Cities › On Row Changed into a Set Property for
title, its Done into one foritem01 › value, that one's Done into one foritem01 › label, and that one's Done into a Fire Trigger forupdate. - Cities › city into the first Value, temperature into the second, conditions into the third.
On air
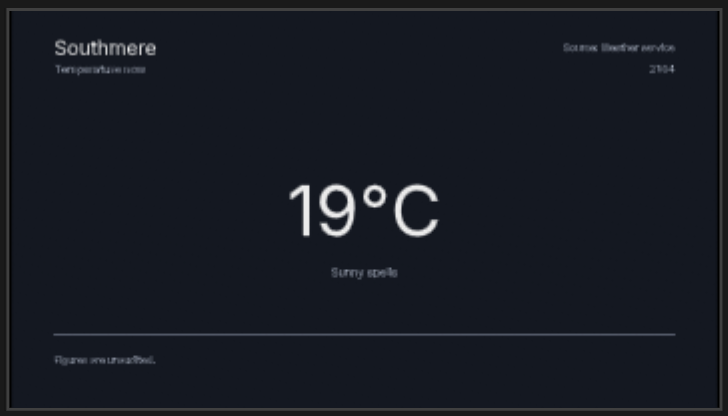
Take the item in. Each time the Database moves to the next row, the title, figure and conditions change and the update animation plays. Its own buttons step back and forward, or pause the carousel.