
How do broadcast graphics fill themselves from live data?
In airZStudio, a broadcast graphic takes its text and numbers straight from a database, a spreadsheet, a feed or a web API, and keeps them current on air without anyone typing. This part follows one weather graphic from airZ Editor through airZ Controller to airZ Engine, and you can play it below.
In short
- A graphic designed in airZ Editor with named fields can be filled by anything that supplies those names: an operator, a newsroom system, or live data.
- airZ Controller reads live data in two ways: it follows a feed (an RSS feed, a web API or a web page) and refreshes it on air by itself, or it reads a table (a spreadsheet, a database file or a PostgreSQL server) and steps through its rows.
- An operator panel puts the data in the control room's hands: its controls and a few wired nodes decide which row, when, and what the graphic does with it.
- When a source stops answering, air keeps the last good values and the control room is told. Nothing goes blank.
The case: ten cities, nobody typing
A weather segment shows ten cities, one every six seconds, each with its temperature, conditions, wind, humidity and the day's high and low. The sky changes with each city: sun over Madrid, rain over Amsterdam, a storm over Milan.
Typed by hand, that is eighty values to enter and check before air, and again at every update. Filled from data, it is one table and one setting. The graphic below is the same file airZ Engine plays on air, filled from the same table.
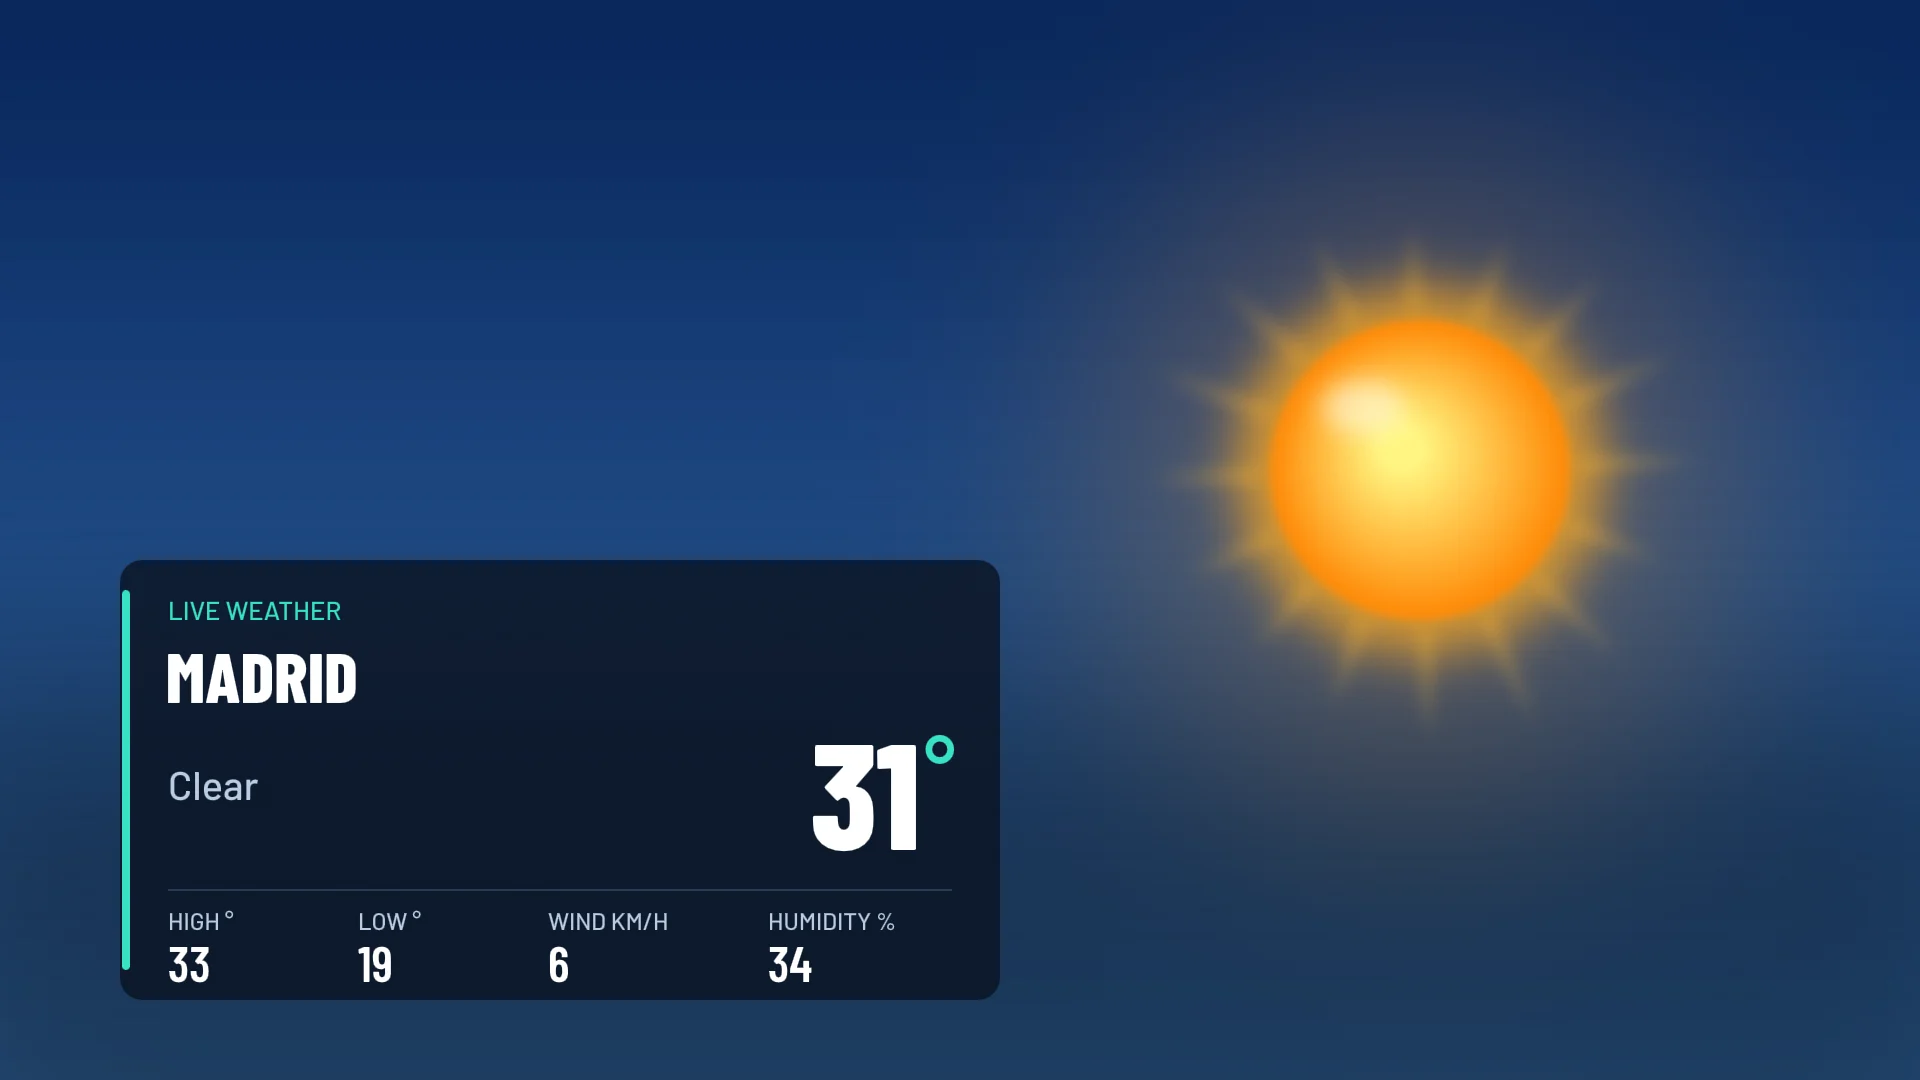
Playing live in your browser: every six seconds the page sends the next row of the table to the graphic, as airZ Controller does on air. Pick a city to jump to it, or a weather to switch the sky and icon of the city on air, as an operator panel does. Third-party licences
What does "live data" mean for a graphic?
A graphic doesn't know where its data comes from. It knows its fields: the named values the designer exposed, such as city, temperature and code. Whatever supplies those names fills the graphic: an operator typing, a newsroom rundown, or a data source. That separation is what makes live data safe. The designer decides what can change and how it looks; the data decides only what it says.
| Term | Meaning |
|---|---|
| Field | A named value in the graphic, such as city. The designer names it once |
| Source | Where the values come from: a feed, a web API, a web page, a spreadsheet, a database |
| Link | Which part of the source fills which field |
| Refresh | How often the source is read again |
| Update | Sending new values to a graphic already on air, without playing its entrance again |
What data can airZ Controller read?
Two families: tables, which hold many rows, and feeds, which hold the latest values. Both are chosen in airZ Controller's own windows, with no query or code to write.
| Source | What it is | Read by |
|---|---|---|
| Spreadsheet | A .csv or .xlsx file; the first row names the columns (in an .xlsx, the first sheet) | An operator panel's Database control, list or menu |
| Database file | A SQLite file: .db, .sqlite | An operator panel |
| Database server | PostgreSQL, read-only | An operator panel |
| Web API | JSON from a web address, or a file | A data link on the template |
| RSS feed | A news or data feed, from a web address or a file | A data link |
| Web page | A value picked out of a page, by pointing at it | A data link |
From a table, a panel takes only the rows it needs: Only rows where a column matches, Order by, related tables joined by a shared column, duplicates hidden and a maximum number of rows. And beside live data, the same fields are filled by a newsroom system over MOS, by XML bulletins, from a folder of pictures, or by an operator typing.
Two ways data reaches a graphic
| Follow a feed | Read a table | |
|---|---|---|
| Sources | RSS feeds, web APIs (JSON), web pages | Spreadsheets (.csv, .xlsx), database files (SQLite), PostgreSQL |
| Typical use | One current value: a river level, a price, a score | Many rows: cities, results by district, a league table |
| On air | Read again on a timer, every 5 seconds or more; only changed values go to air | The operator picks a row, or the rows step by themselves every few seconds |
| If the source fails | The rundown row shows FEED STALE; air keeps the last values | A banner warns that the lists show the last values read |
Values can also come from a newsroom system over MOS, or from an operator. The graphic is the same either way.
How it works in practice
1. Name the fields, in airZ Editor
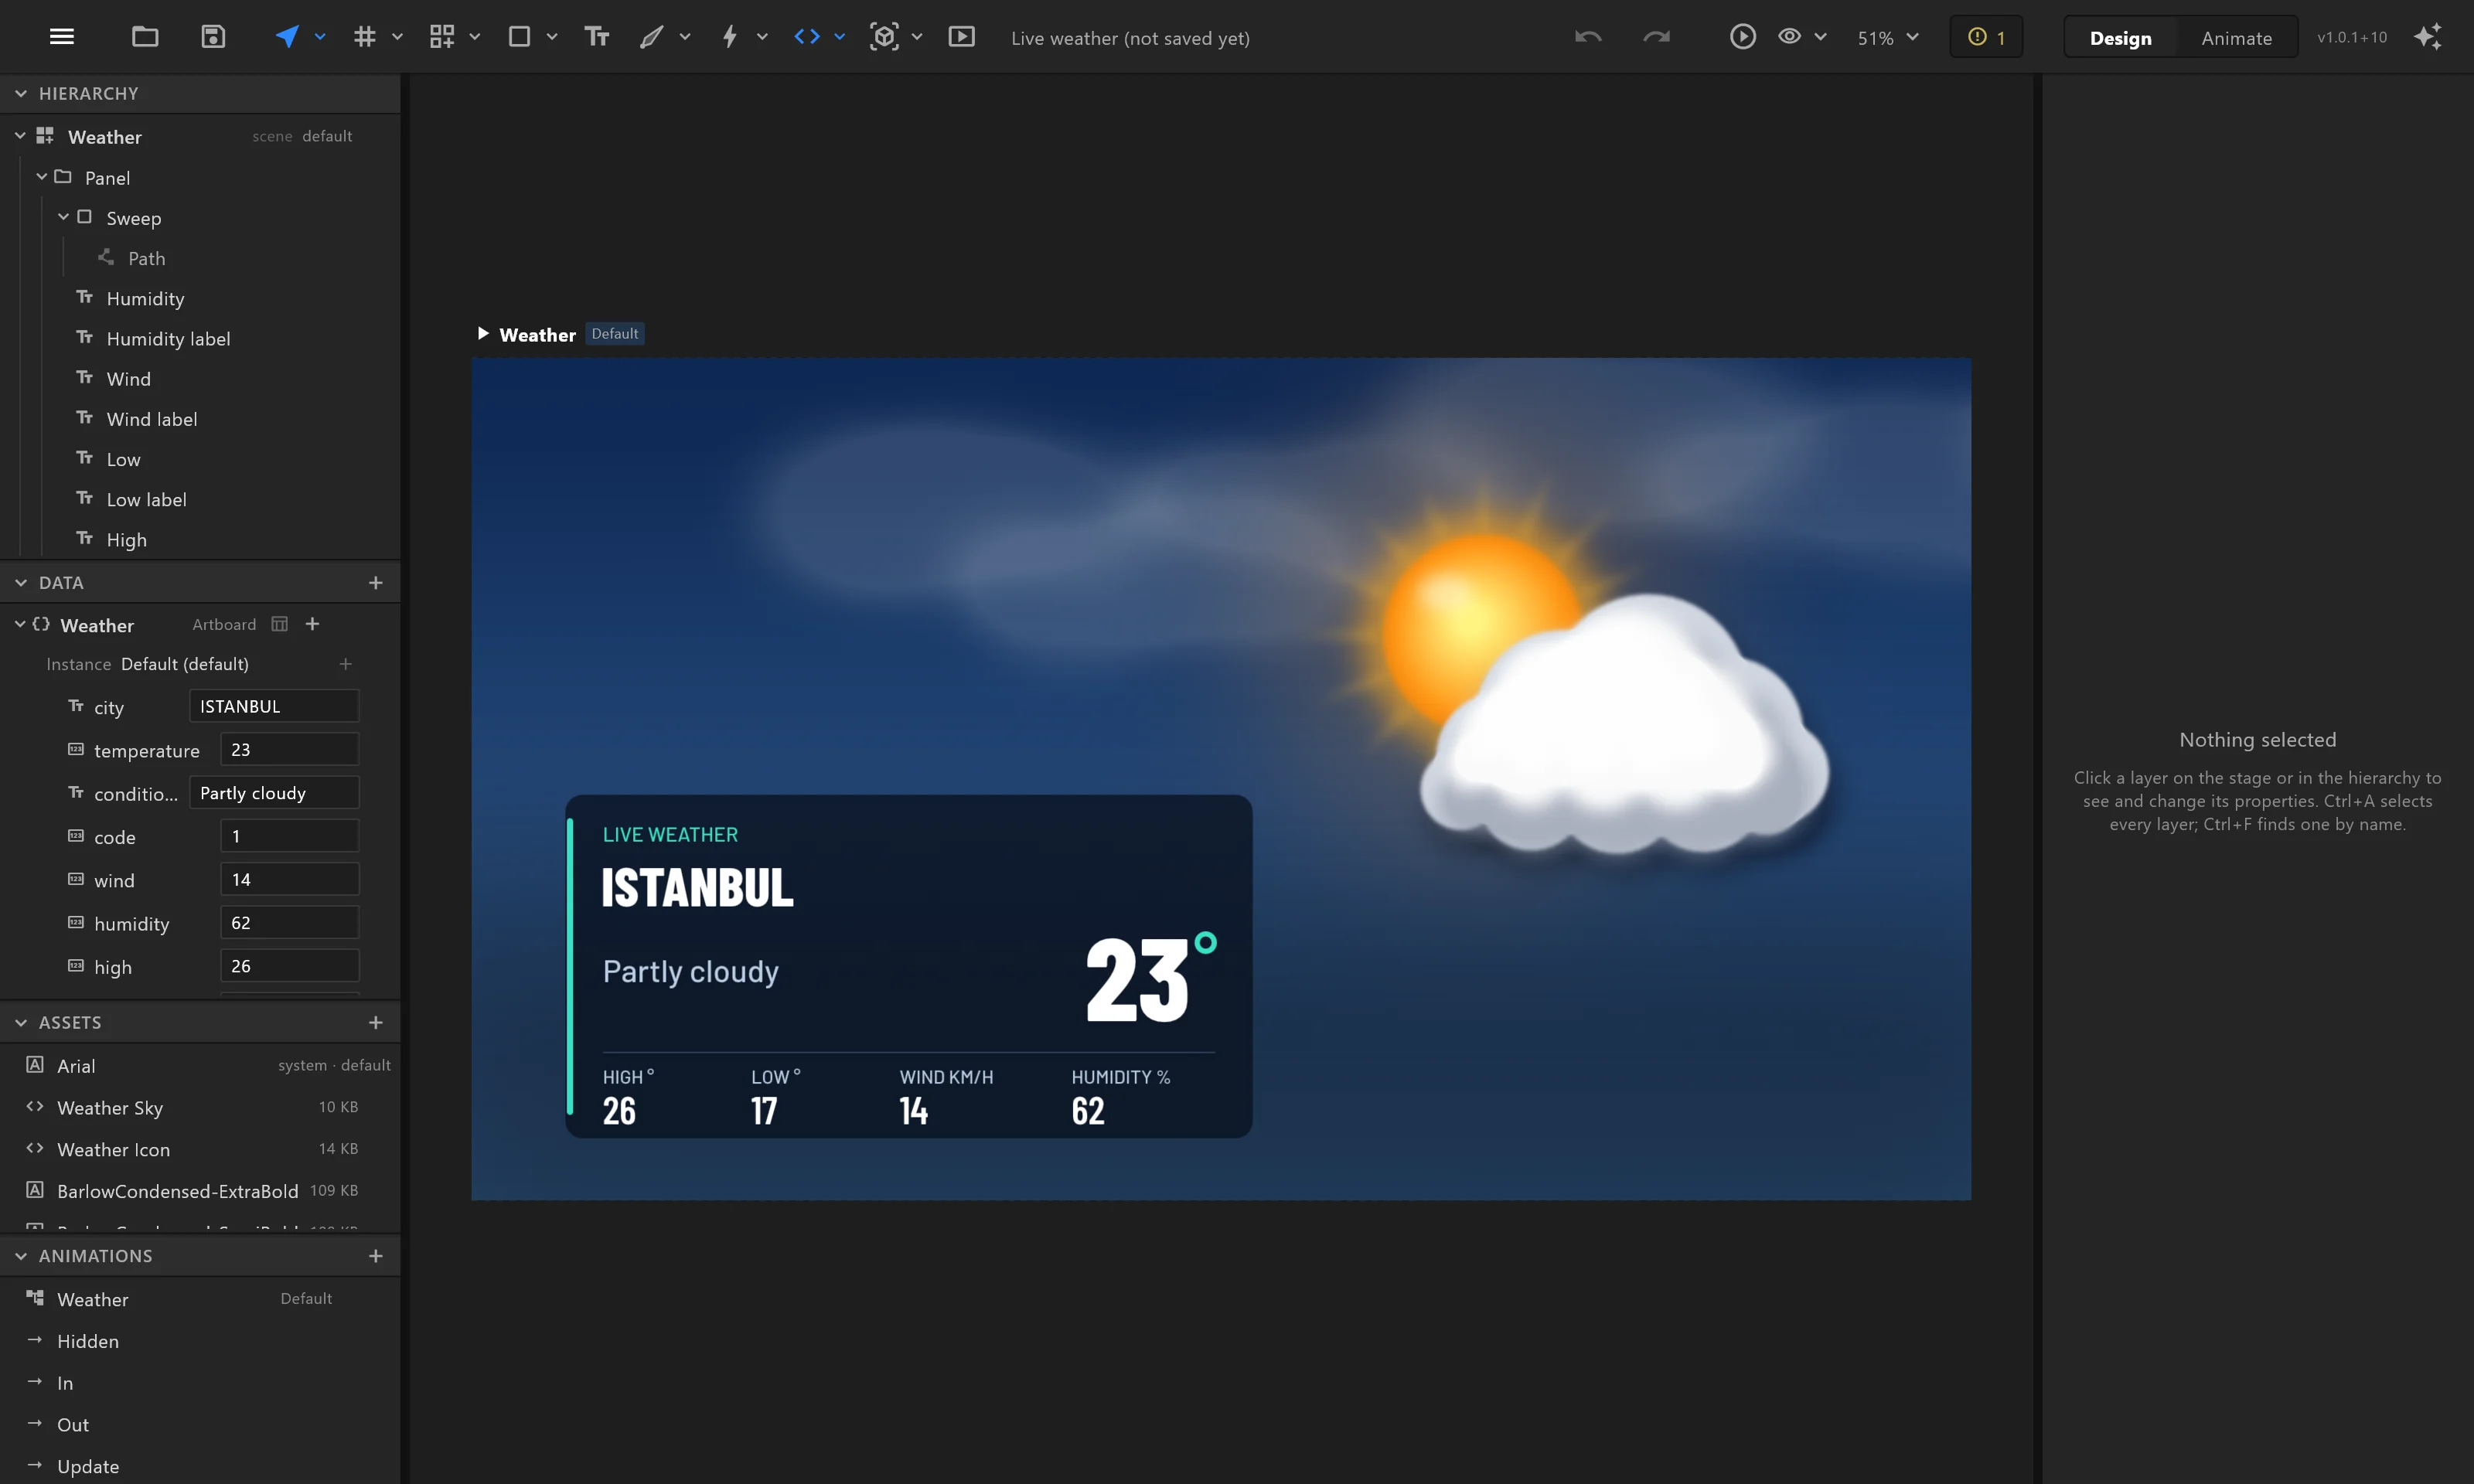
The graphic is the Live weather template on airZ Editor's Start screen, so you can open it and follow along. The designer builds the graphic and names what changes. Here code is a number from 0 to 9 that chooses the sky, so the table only has to say 3 for rain to fall. The names in the Data panel are the names every other part of the system uses. File › Send to air… puts the graphic in airZ Controller's library.
2. Point it at the data, in airZ Controller
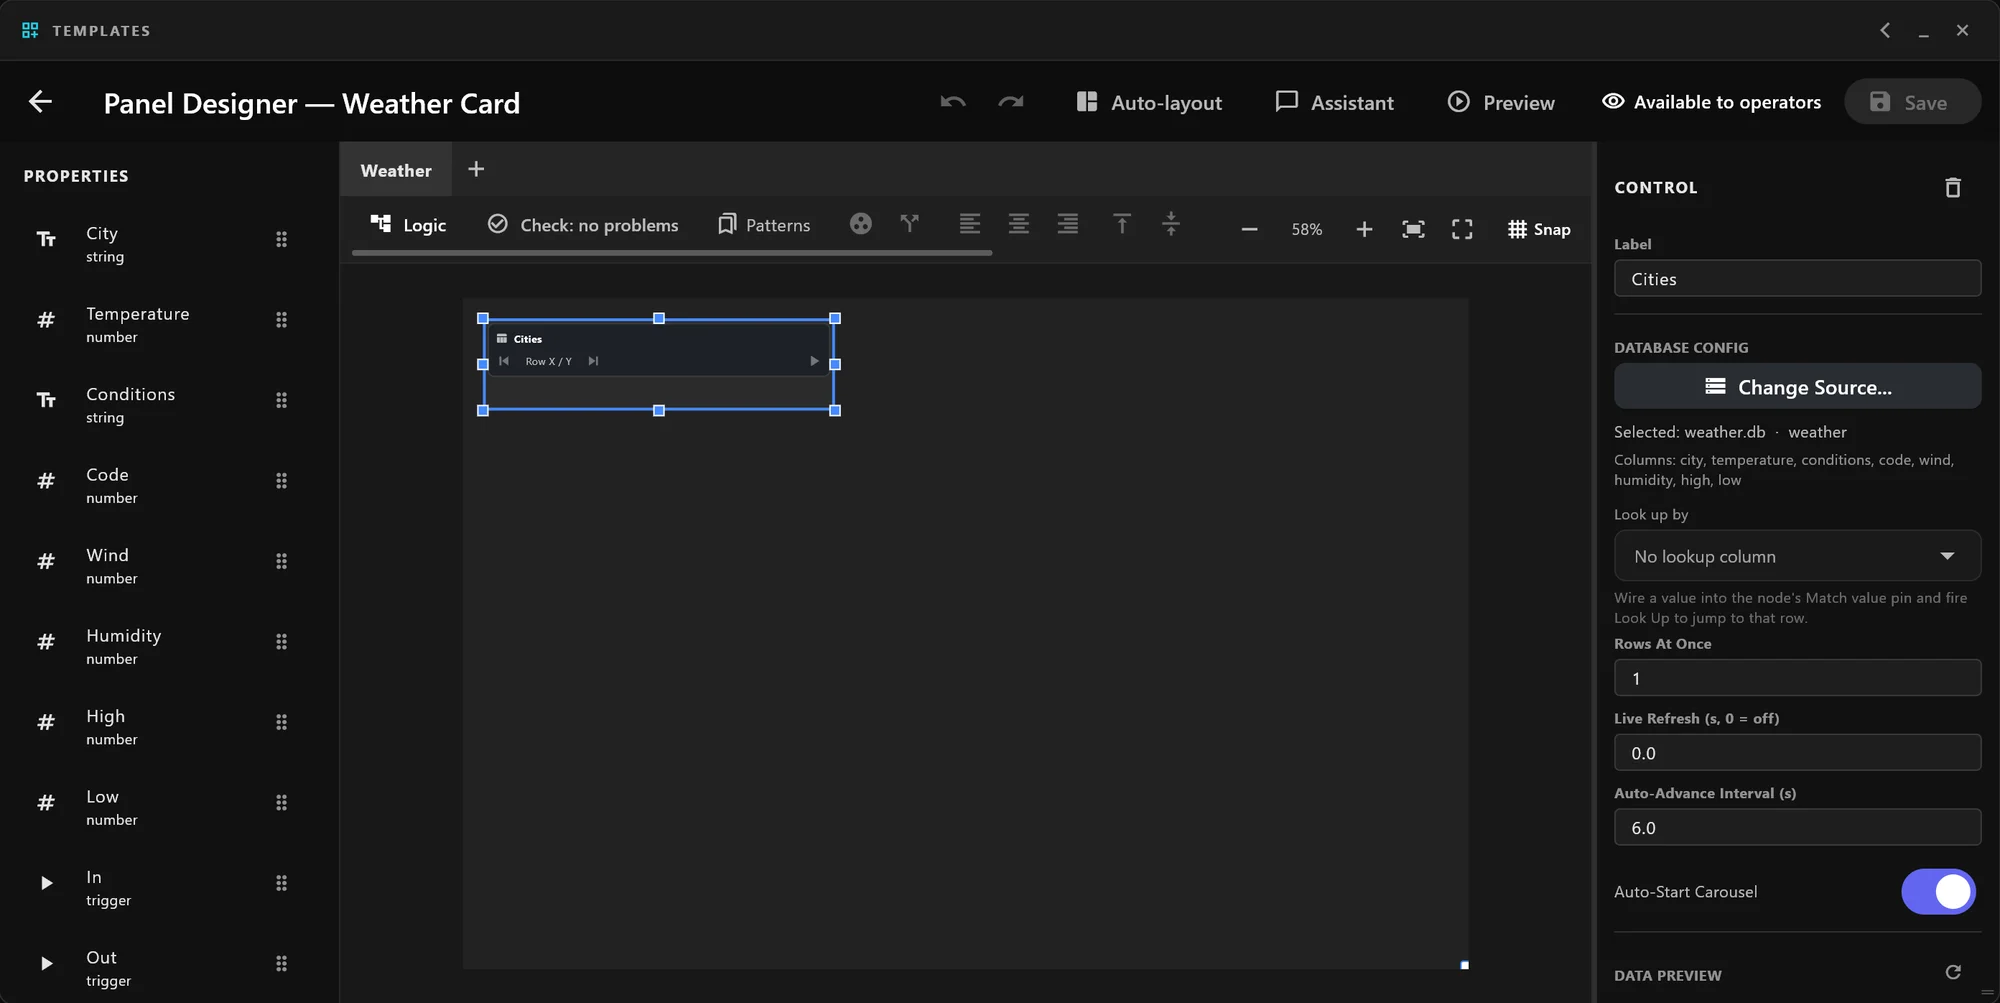
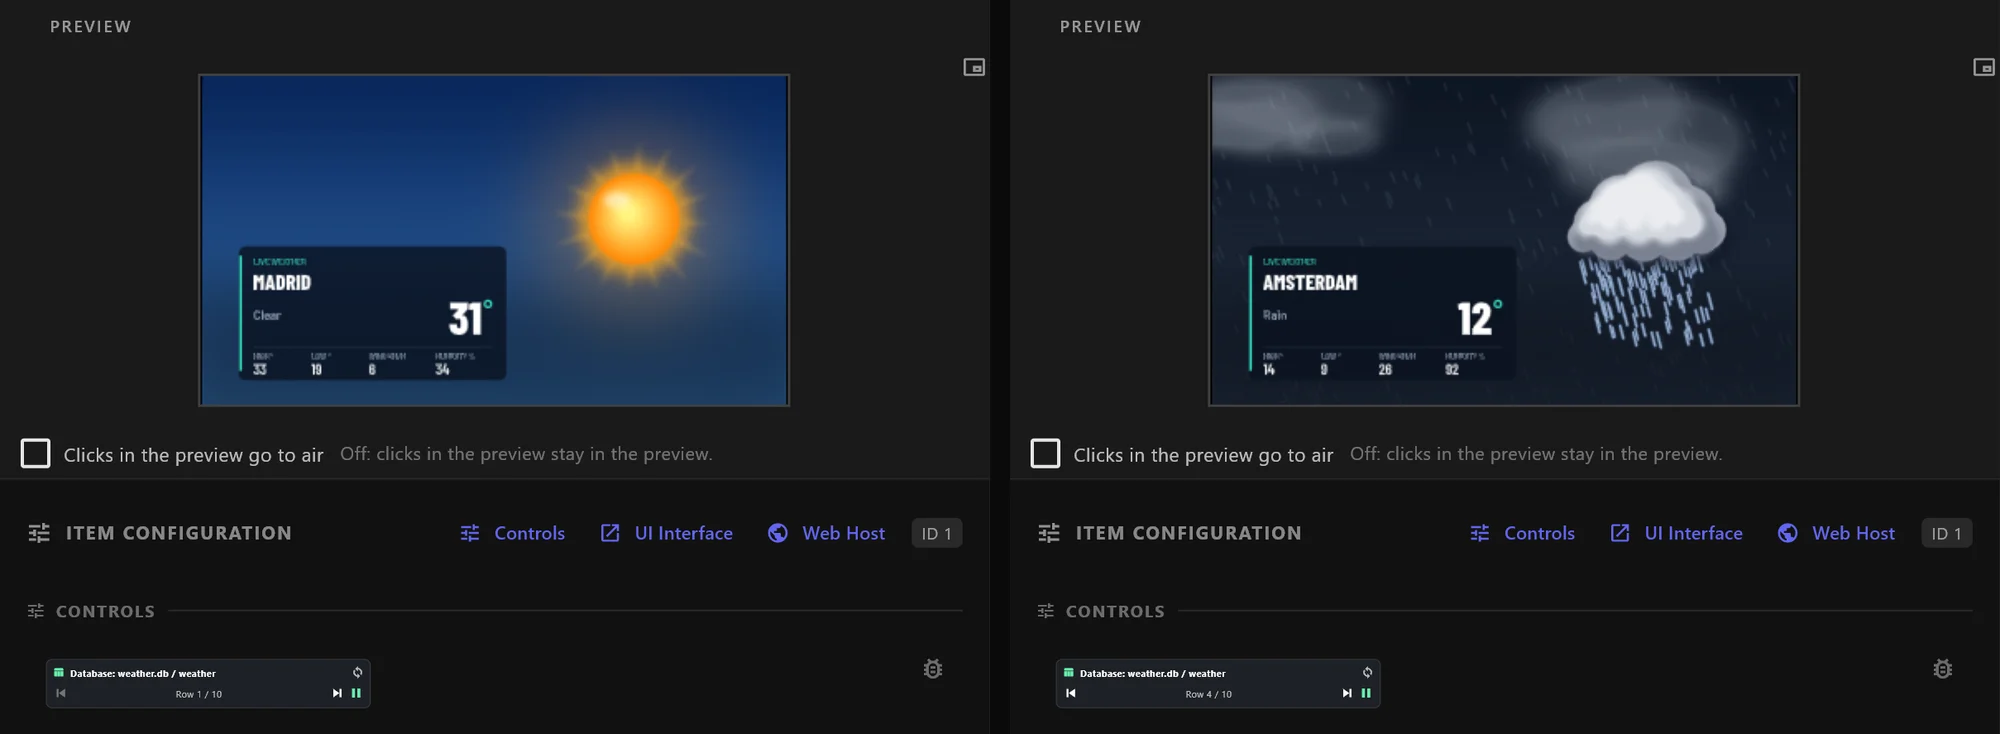
weather table, one row at a time, the next every six seconds.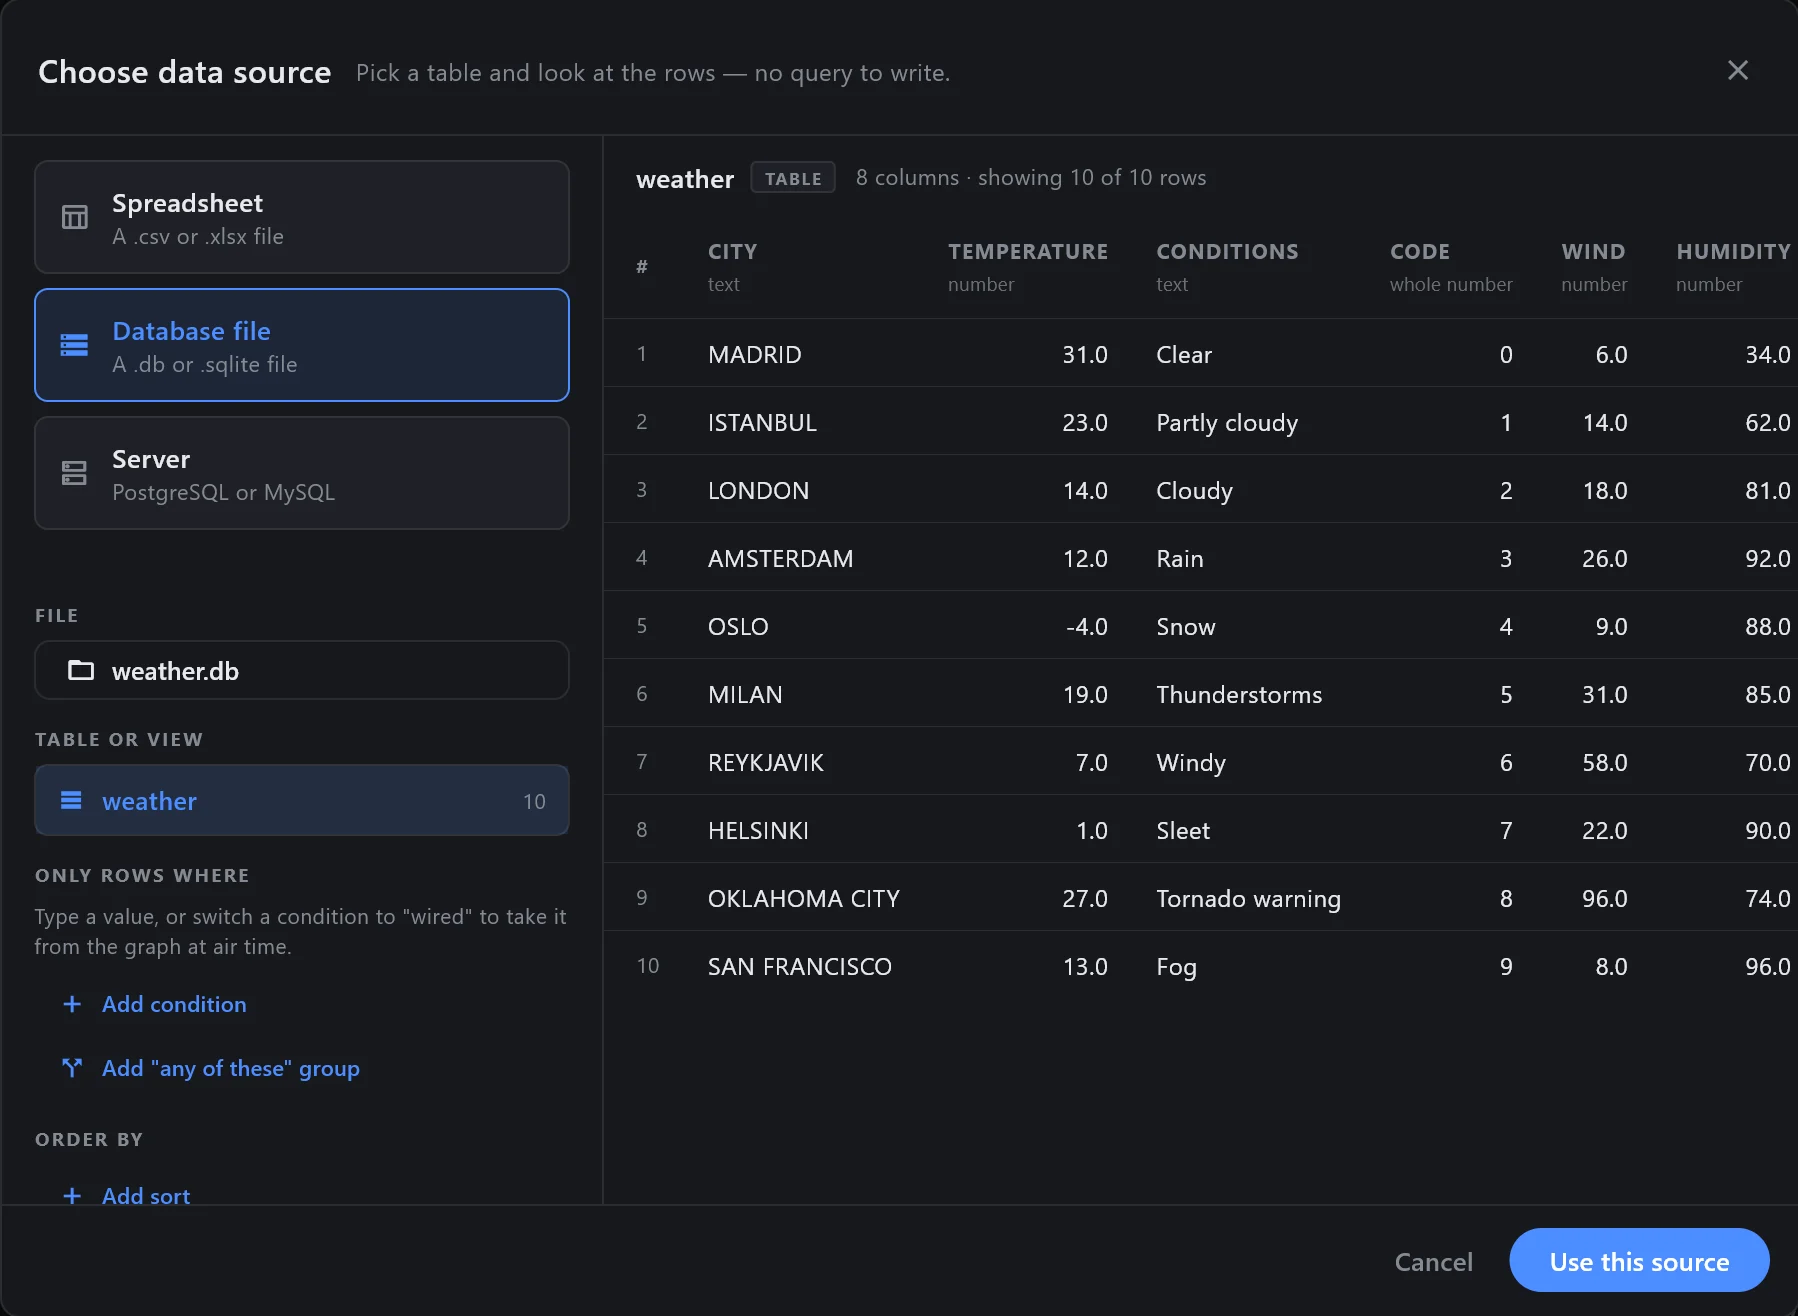
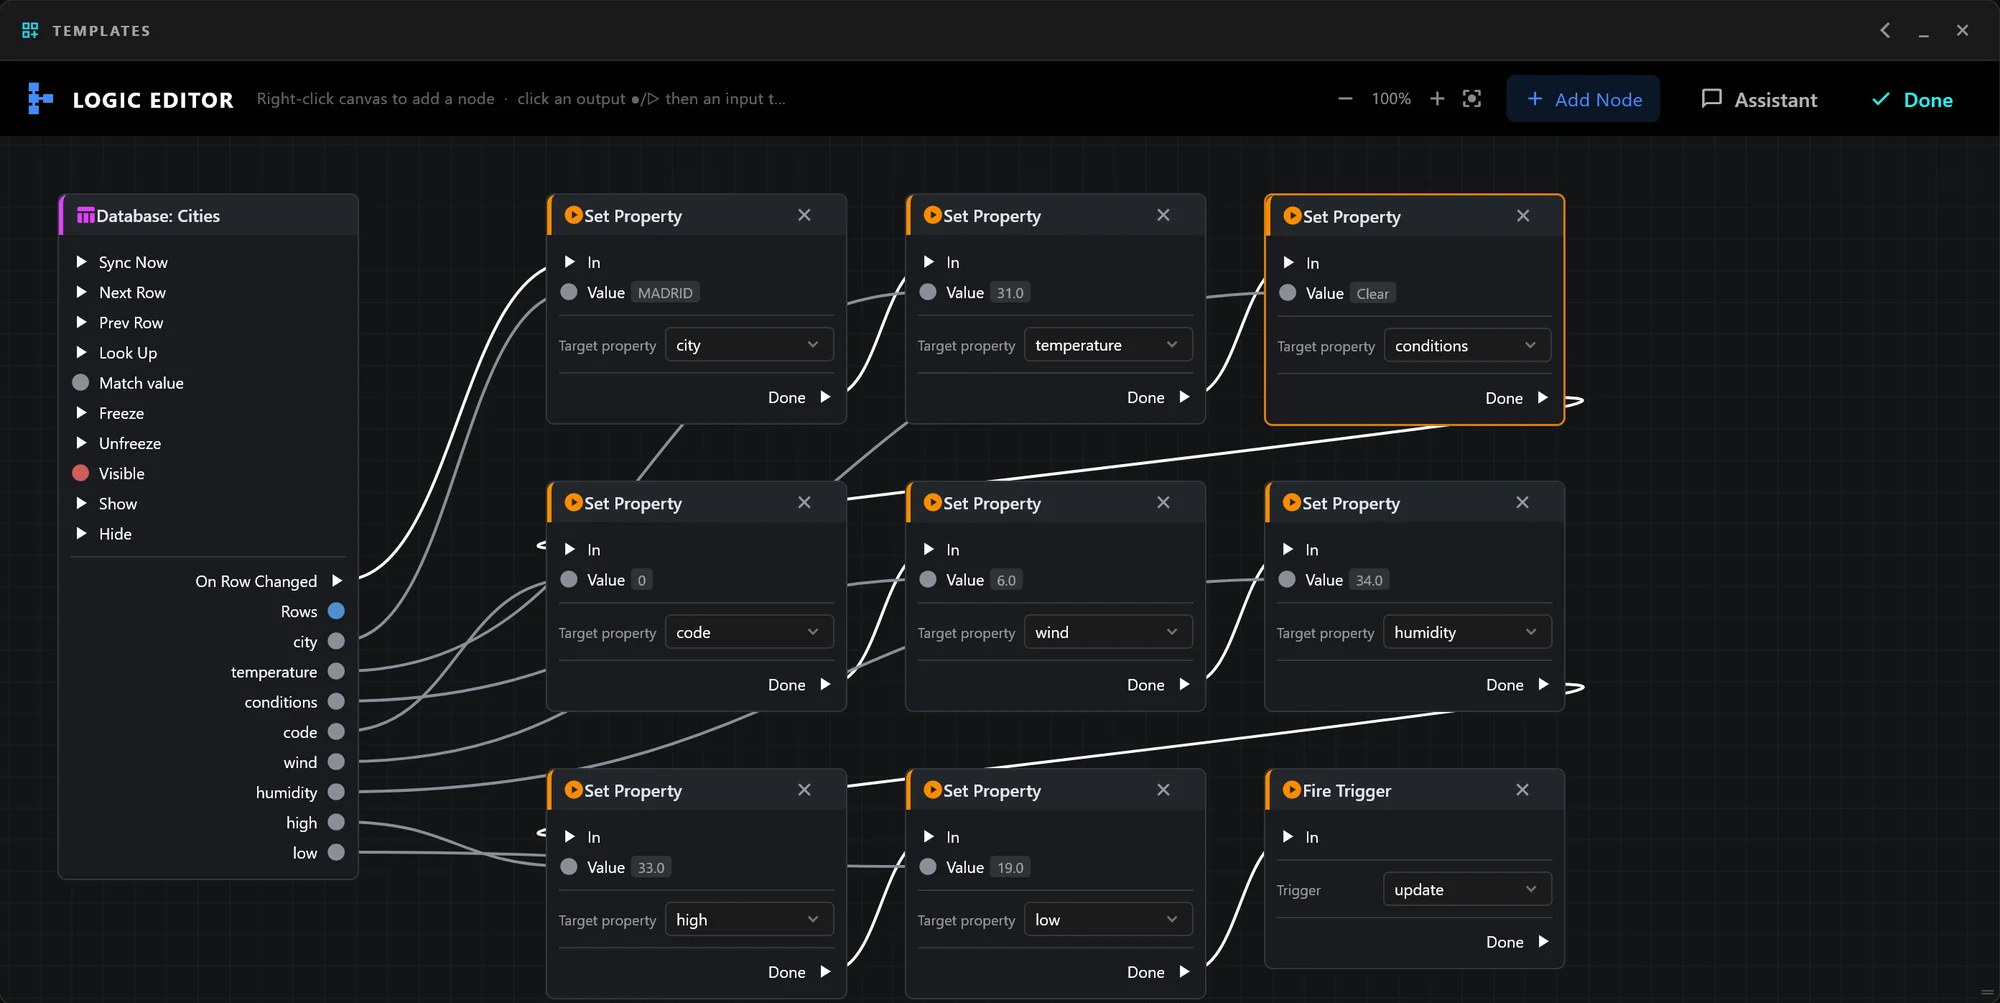
In airZ Controller the template gets an operator panel with a Database control. It reads the weather table one row at a time and moves to the next row every six seconds. A short chain of logic sends each column to the field of the same name and fires the graphic's update after each row, so the card sweeps to the new city.
The operator panel: the control room's own controls
An operator panel is a small control surface built for one template, in airZ Controller's Panel Designer: buttons, switches, lists, menus and Database controls, laid out for the people who run the show. A list or a menu can fill its choices from data too, such as a list of districts read from the results table. When it is ready, the designer switches it from Draft to Available to operators.
The operator meets the panel in the item's Item Configuration, over the window with Controls, or on a second screen with UI Interface, which follows the item selected in the rundown. A panel works in one of three ways:
| Mode | What a change does |
|---|---|
| Staged | Changes the preview and the item. Nothing goes to air. Panels open this way |
| On Air | Holds changes until a trigger fires, or until Update On-Air |
| Armed | Every change goes to air at once |
update fires.The node flow: how a row becomes a graphic
The panel's Logic Editor connects controls to the graphic with nodes and wires, the way a vision mixer's macro chains steps. Two kinds of pins: ▷ carries a step, "now do this", and ● carries a value. In the weather panel the Database control's On Row Changed starts the chain; each Set Property takes a column's value into the field of the same name and passes the step on with Done; the last step fires update.
| Family | Nodes | For example |
|---|---|---|
| Controls | Every control on the panel: a Database control with its rows and columns, a list, a menu, a button, a switch | Database: Cities gives On Row Changed and the row's city, temperature … |
| Data | Constant, Format, Select, Row Fields, variables, Now | Format with {} km/h turns 26 into "26 km/h" |
| Logic | Compare, Equals, Boolean, Math, Clamp, Map Range, Join Text, Change Case, Cut / Replace Text, Format Date | Compare code >= 5 to know a storm is coming |
| Flow | Branch, Switch, Sequence, Gate, Delay | Branch on that comparison, to fire a warning only when it is true |
| Actions | Set Property, Fire Trigger, Set Visibility, Set Transform | Set Property fills a field; Fire Trigger plays update |
Nothing here is code: the logic is wired, checked by the editor as you build it, and saved with the panel. The data says what changed; the logic decides what the graphic does about it.
3. On air, in airZ Engine

The operator takes the item to air once. From then on airZ Engine renders each new city as it arrives, the sky blending from one weather to the next at the channel's frame rate. Nobody types a value.
The other way: follow a feed
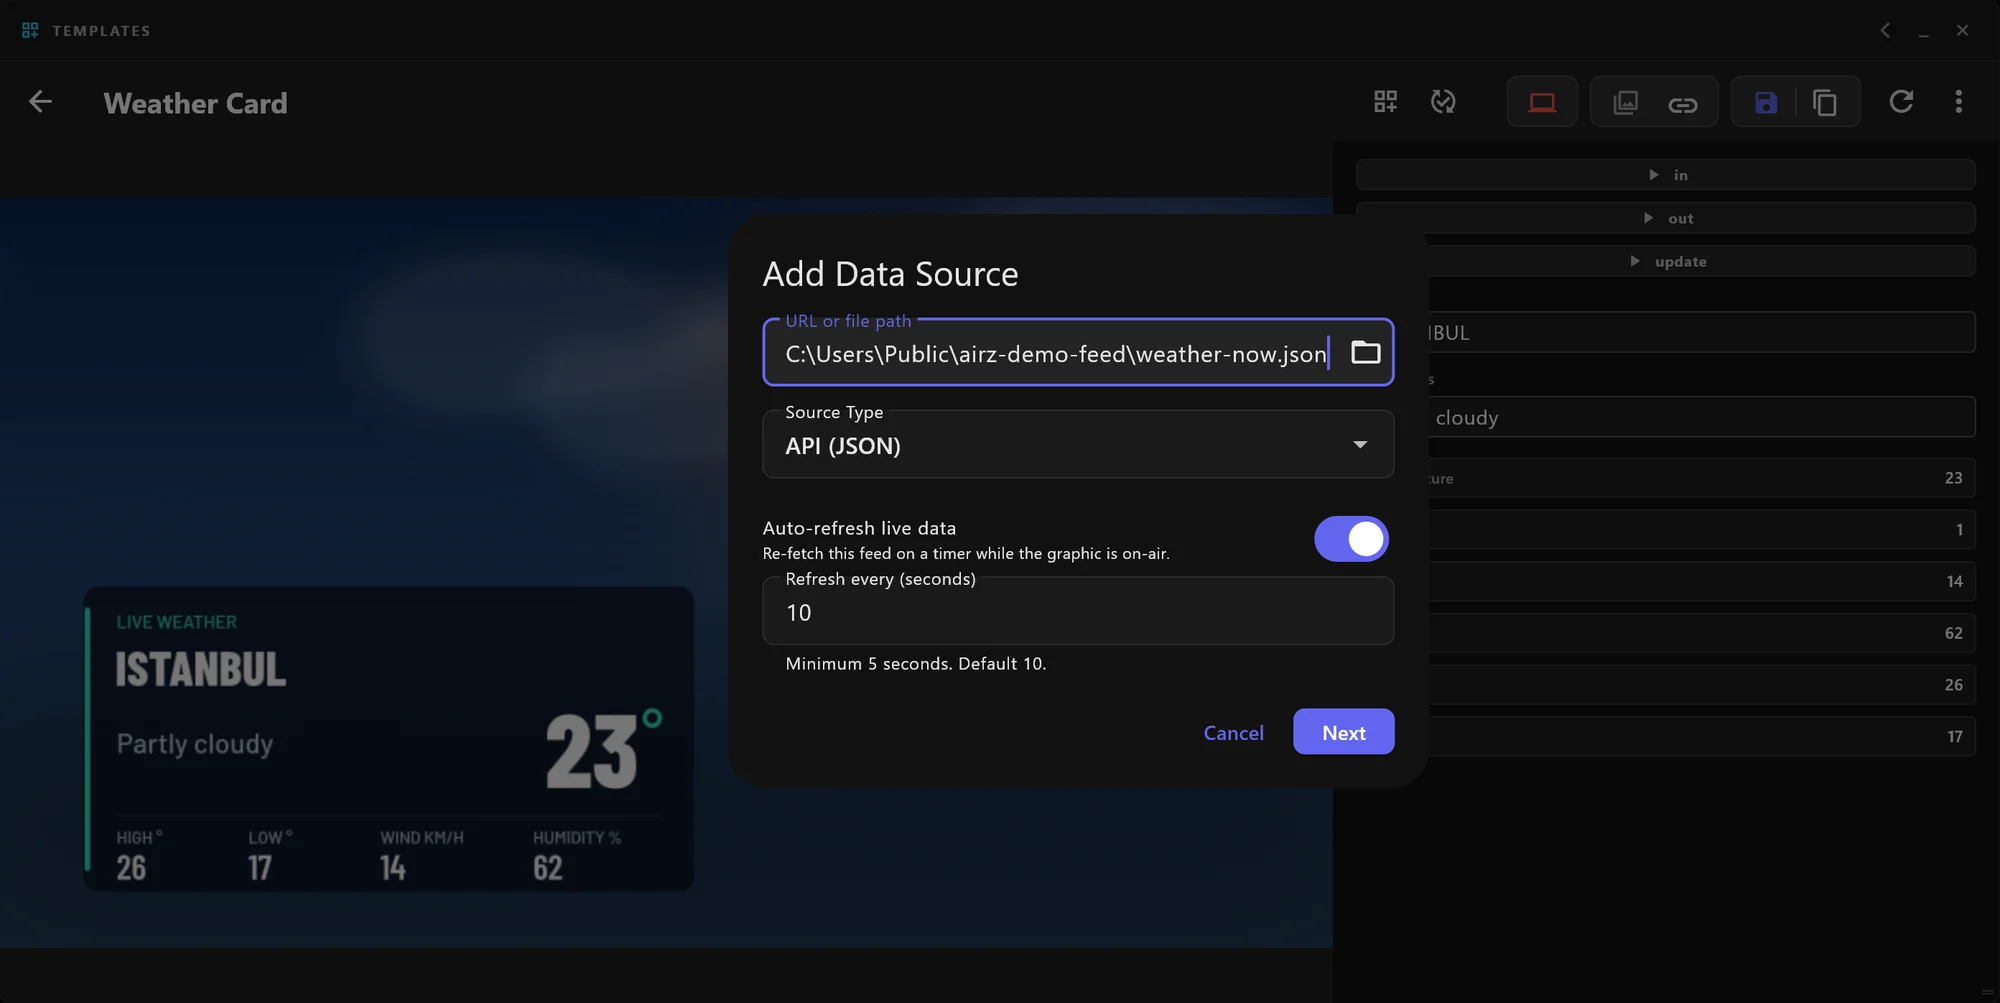
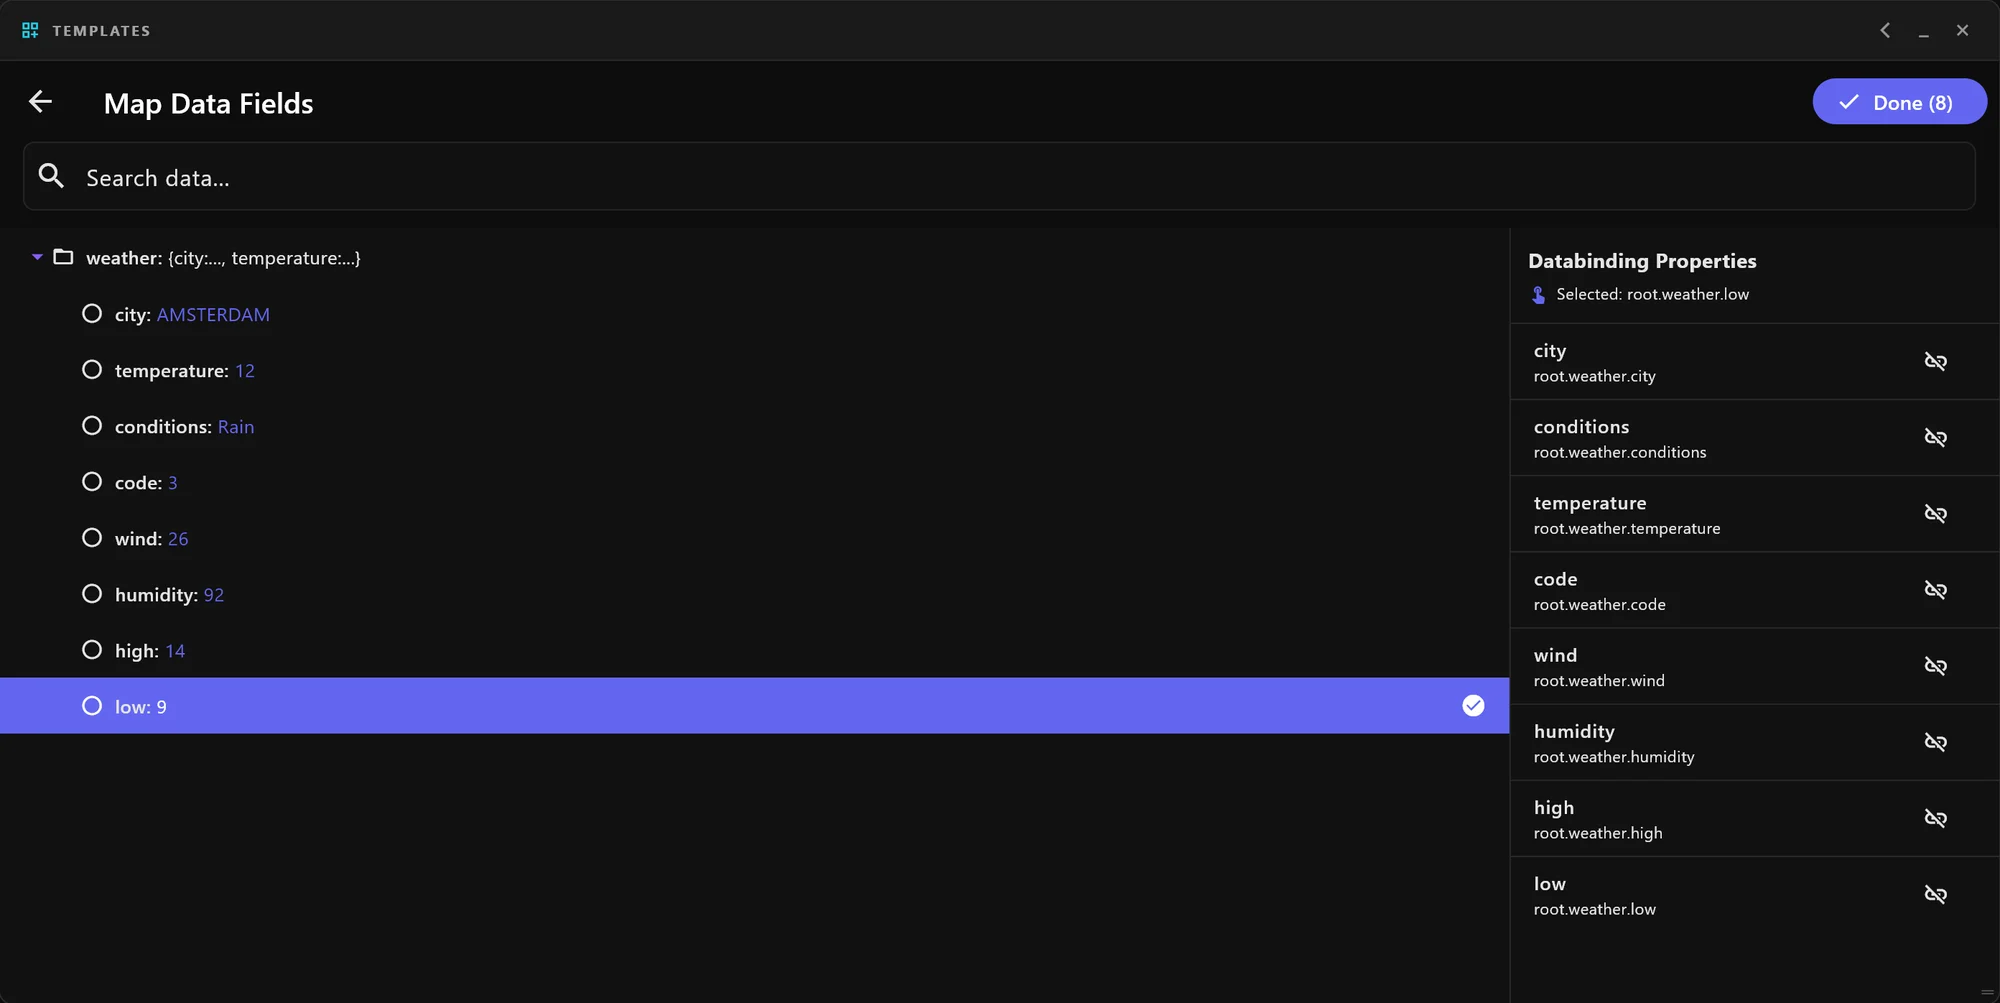
For one city's current weather, a web API is simpler. Add Data Source takes its address, Map Data Fields shows the API's data beside the graphic's fields, and Assign links them. While the item is on air the feed is read again on its timer, every 10 seconds unless changed, and only values that changed are sent.
What happens when the source fails?
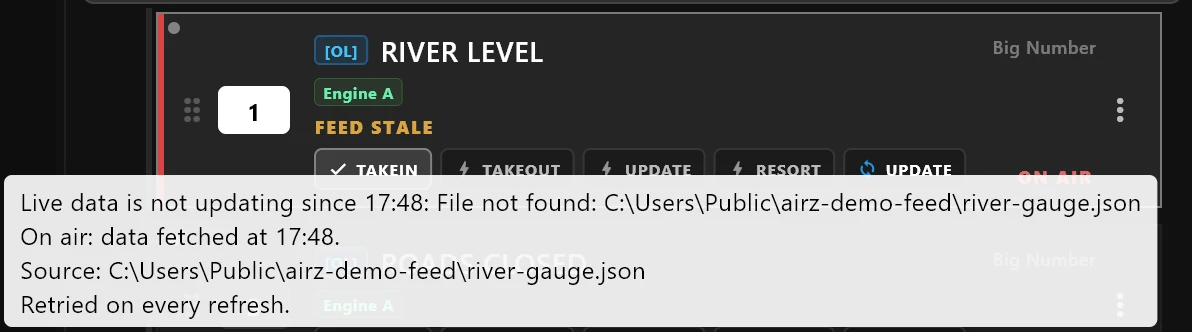
Live data is only useful if it fails safely. When a feed stops answering, or arrives without a field it used to have, the item's row shows FEED STALE beside ON AIR. Air keeps the last values that arrived; nothing goes blank. Pointing at the mark says since when, why, such as no answer within 15 seconds, an HTTP error, or a feed that may have changed shape, and from where. The feed is tried again at every refresh, and the mark goes when it answers.
Why format numbers in the graphic, not in the data?
A table holds plain values: -4, 0.41, 1284500. How they look on air, "−4°", "41%", "1,284,500", is part of the design, so it belongs in the graphic. airZ Editor's converters format numbers, and one of them makes a figure count up to its new value instead of jumping, as the temperature does here.
Questions people ask
How often does live data refresh on air?
A feed or a web API is read again on a timer set per template, every 5 seconds at the shortest; a new template starts at 10 seconds. A table's rows can step by themselves every few seconds, or wait for the operator.
Does the graphic play its animation again for every new value?
No. New values go to the graphic on air without replaying its entrance. A graphic can animate the change itself, such as a number counting up or a sky blending, when the designer builds it that way.
What happens on air if the data source goes down?
Air keeps the last good values and the control room is told: FEED STALE on the rundown row for a feed, a warning banner for a table.
Which data sources can airZ Controller read?
Spreadsheets (.csv and .xlsx), database files (SQLite) and PostgreSQL servers, as well as RSS feeds, web APIs that return JSON, and web pages.
Can the operator choose the row instead of stepping through them?
Yes. A Database control has step buttons and can jump to a row by a value, and a list or menu filled from the table lets the operator pick, such as a city and then one of its districts. The panel's logic decides what the choice does to the graphic.
What is an operator panel?
A small control surface built for one template in airZ Controller's Panel Designer: buttons, switches, lists, menus and Database controls, wired to the graphic with nodes in its Logic Editor. Operators use it in the item's settings or on a second screen.
Do I need to write code?
No. Sources and links are chosen in airZ Controller's windows, and an operator panel's logic is wired, not written.
Next in the series: Part 5, how a broadcast ticker works. Before this: Part 3, fill and key, NDI with alpha and genlock.
Every step is in the manuals: Live data and Operator panels in airZ Controller, the Data panel in airZ Editor. To see it with your own data, request a demonstration.
The cities and their weather are sample data, not a forecast.