
From design to air: how a broadcast graphic works in airZ
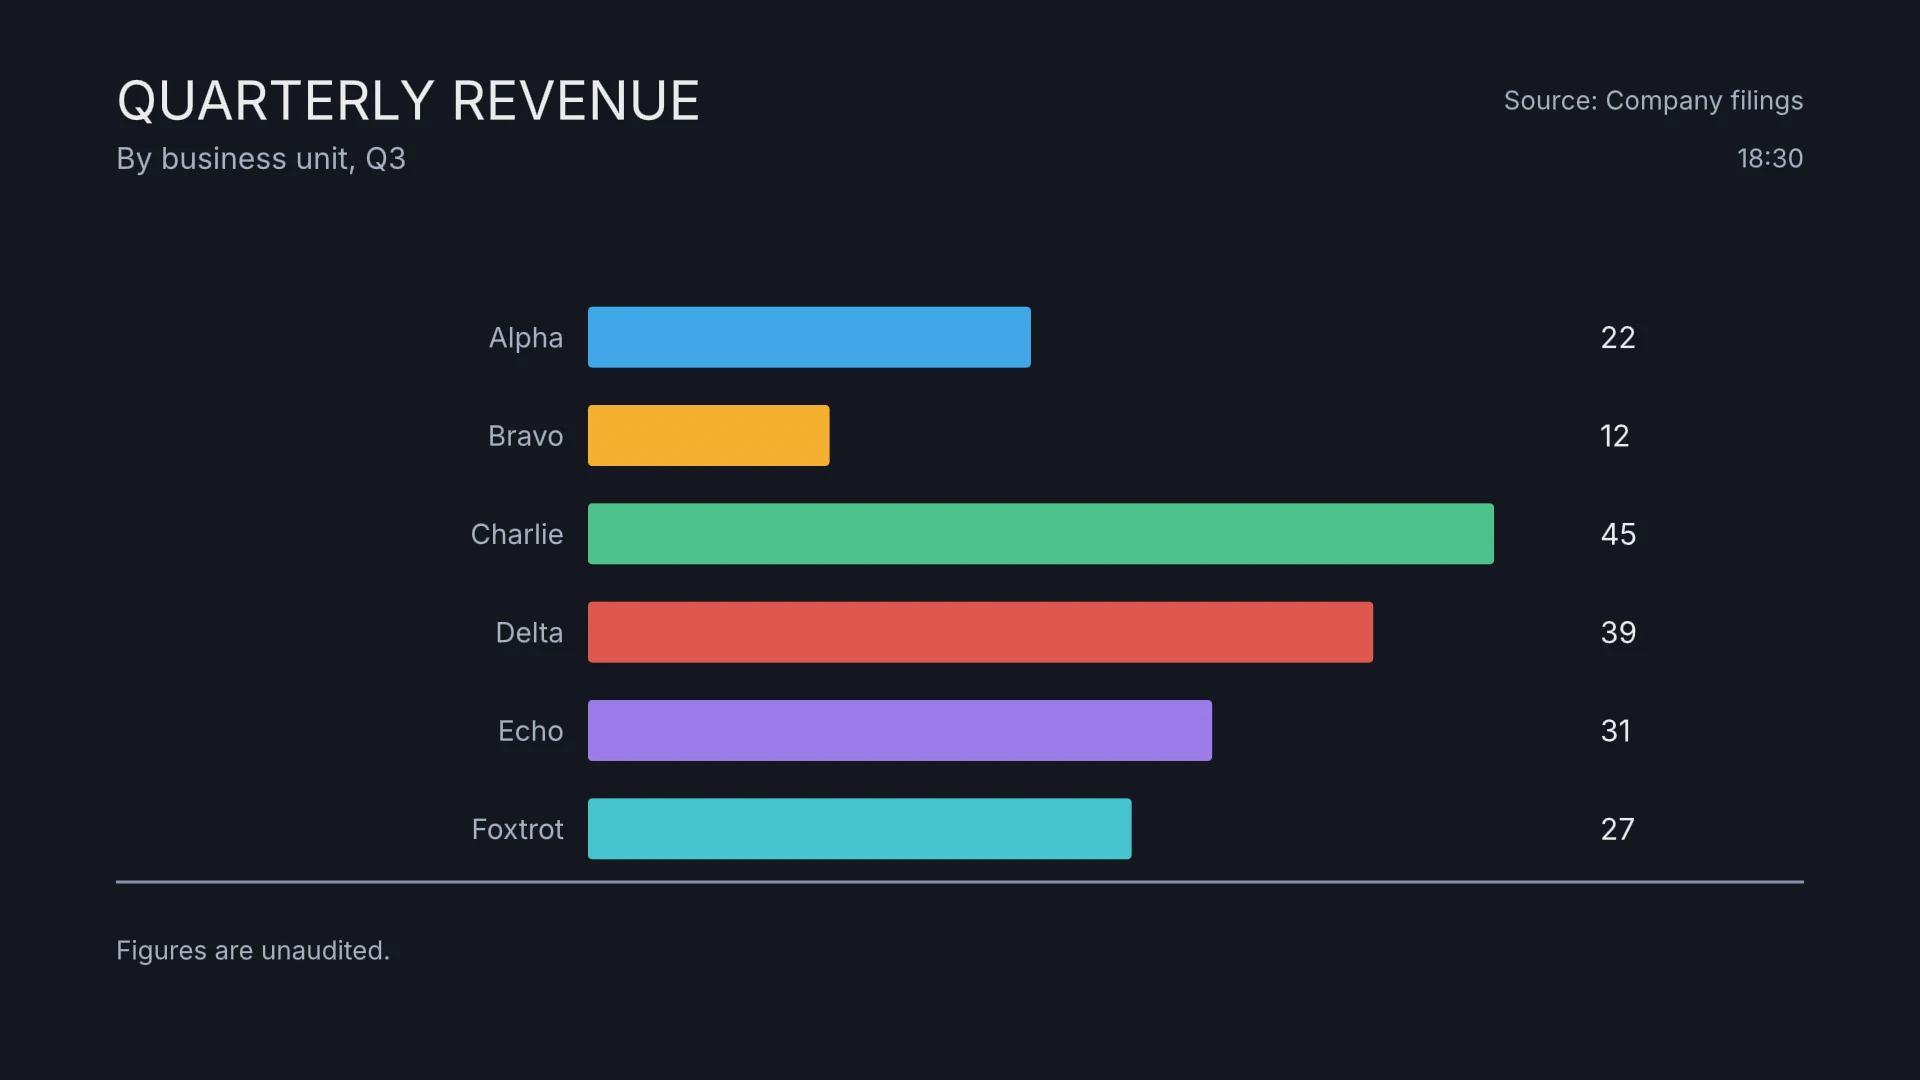
A lower third, a scoreboard or an election map takes the same path in airZ: it is designed once, its changing parts are given names, an operator fills them in the show, and the engine renders it live. This article follows one graphic along that path: a quarterly revenue chart.
 1. Design it, and name what changes
In airZ Editor, the designer builds the graphic: its artwork, how it animates in and out, and in 3D if the show needs it. Then the designer decides which parts change from show to show, such as a name, a role, a colour, a picture or a score, and gives each one a name in the graphic's data.
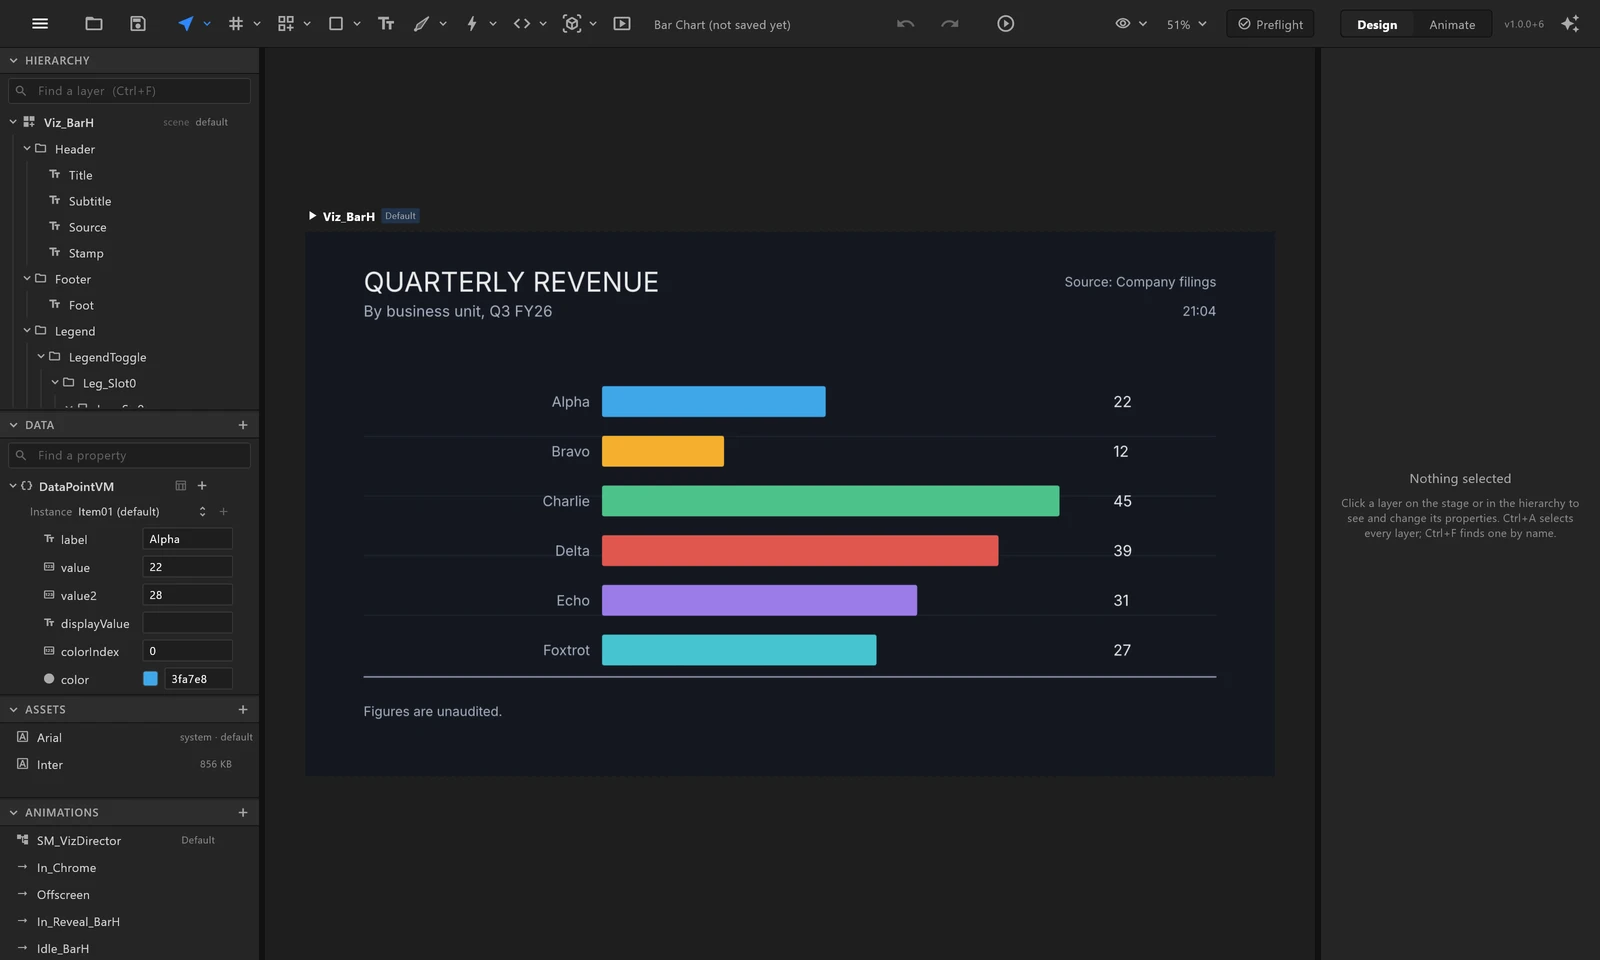
Those names are the graphic's contract with the rest of the system. The designer connects each one to what it changes on screen, so the text, the colour or the length of a bar follows the value. How the graphic behaves is designed the same way: a trigger such as takeIn plays its entrance, another its exit, and a change of value can animate instead of jumping. None of it needs code.
2. Send it to the control room
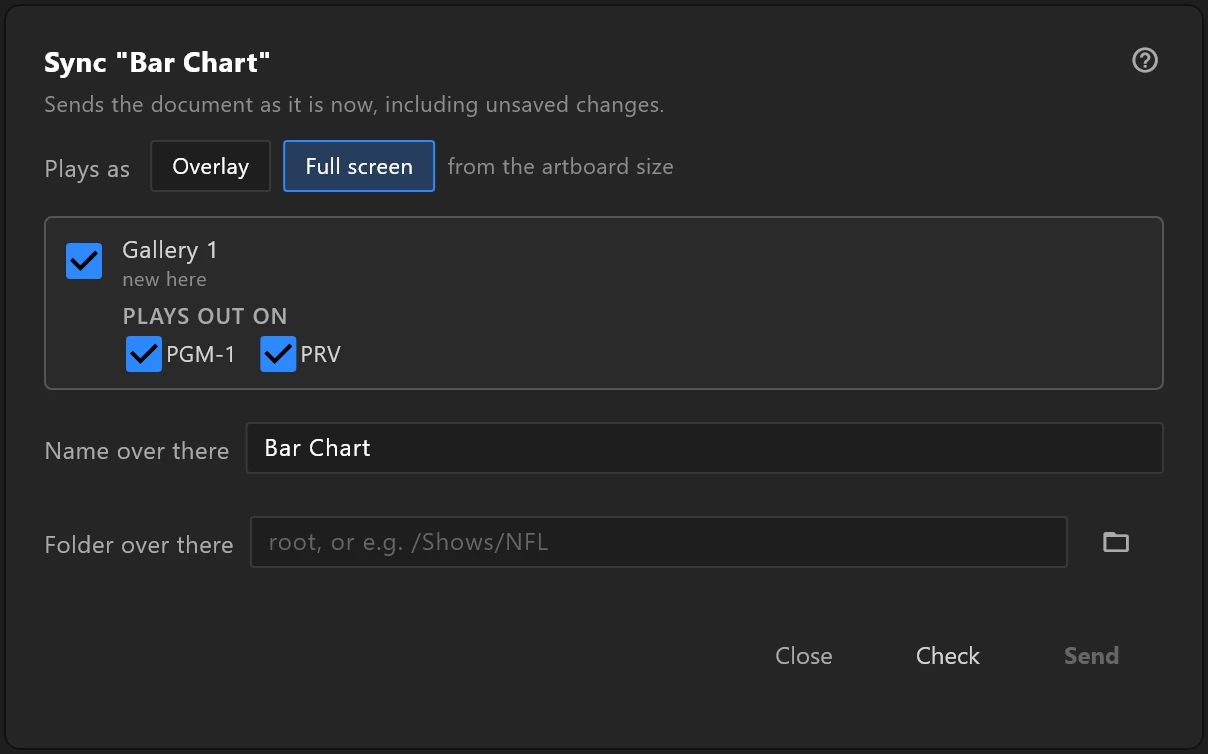
When the graphic is ready, the designer sends it to the control room with Sync to controllers. Before anything changes there, the editor asks each airZ Controller what would happen and shows it: a new template, or an update of one that is already in a rundown.
In airZ Controller, the template arrives in the Templates view, drawn with its sample values and with its triggers and values beside it.
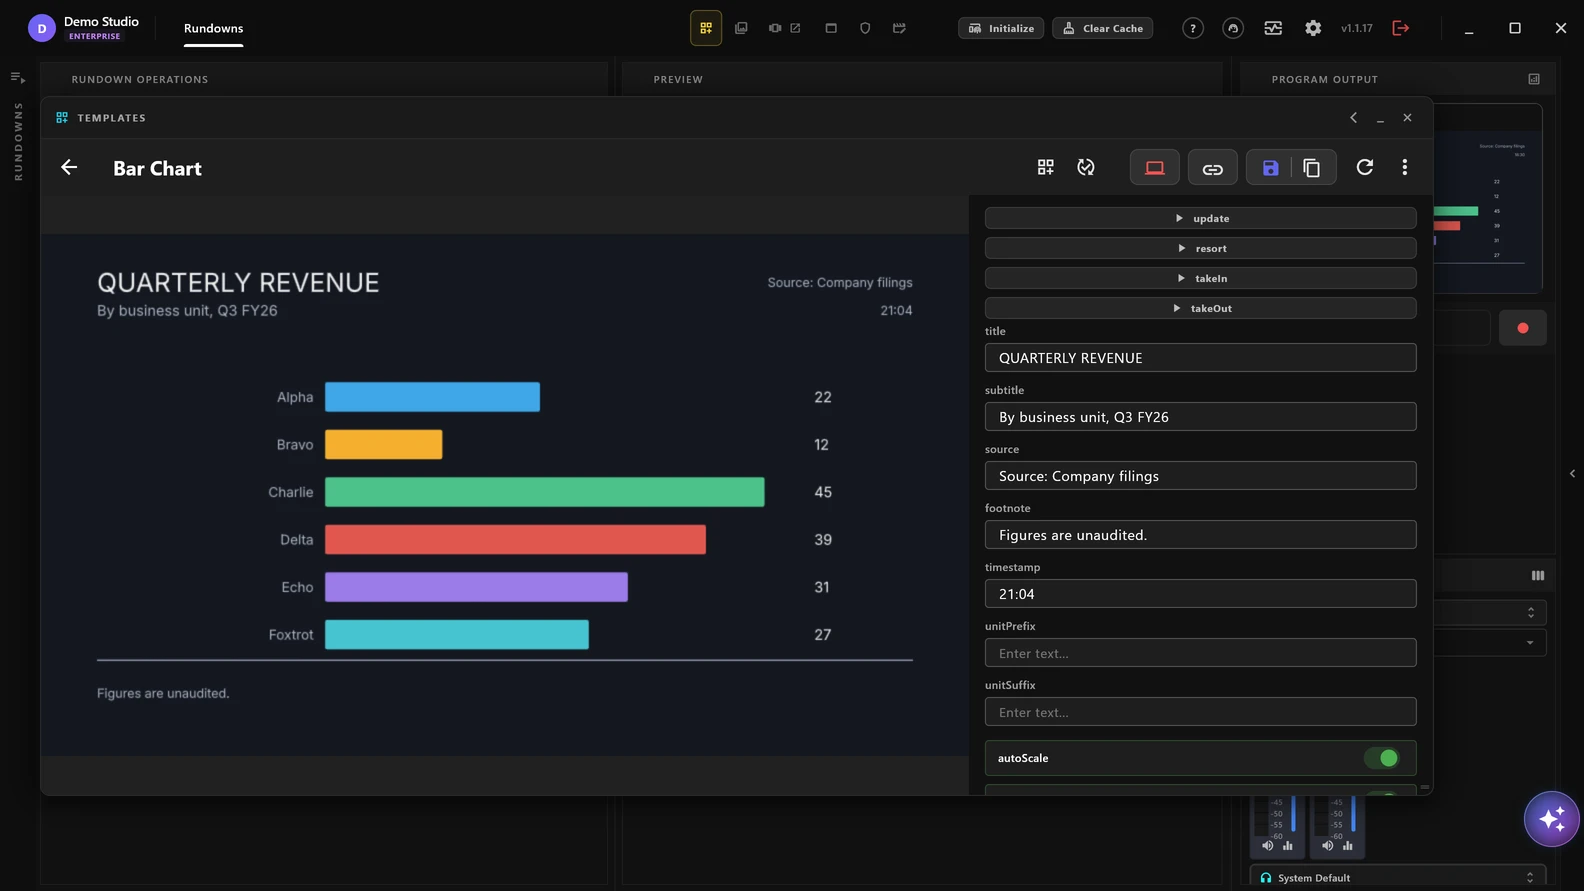
When the designer changes the chart later, the same window sends an update. An update keeps the template's place in every rundown and what an operator has already set up, so a designer can correct a graphic during the day without disturbing the show.
 3. Fill it in the rundown
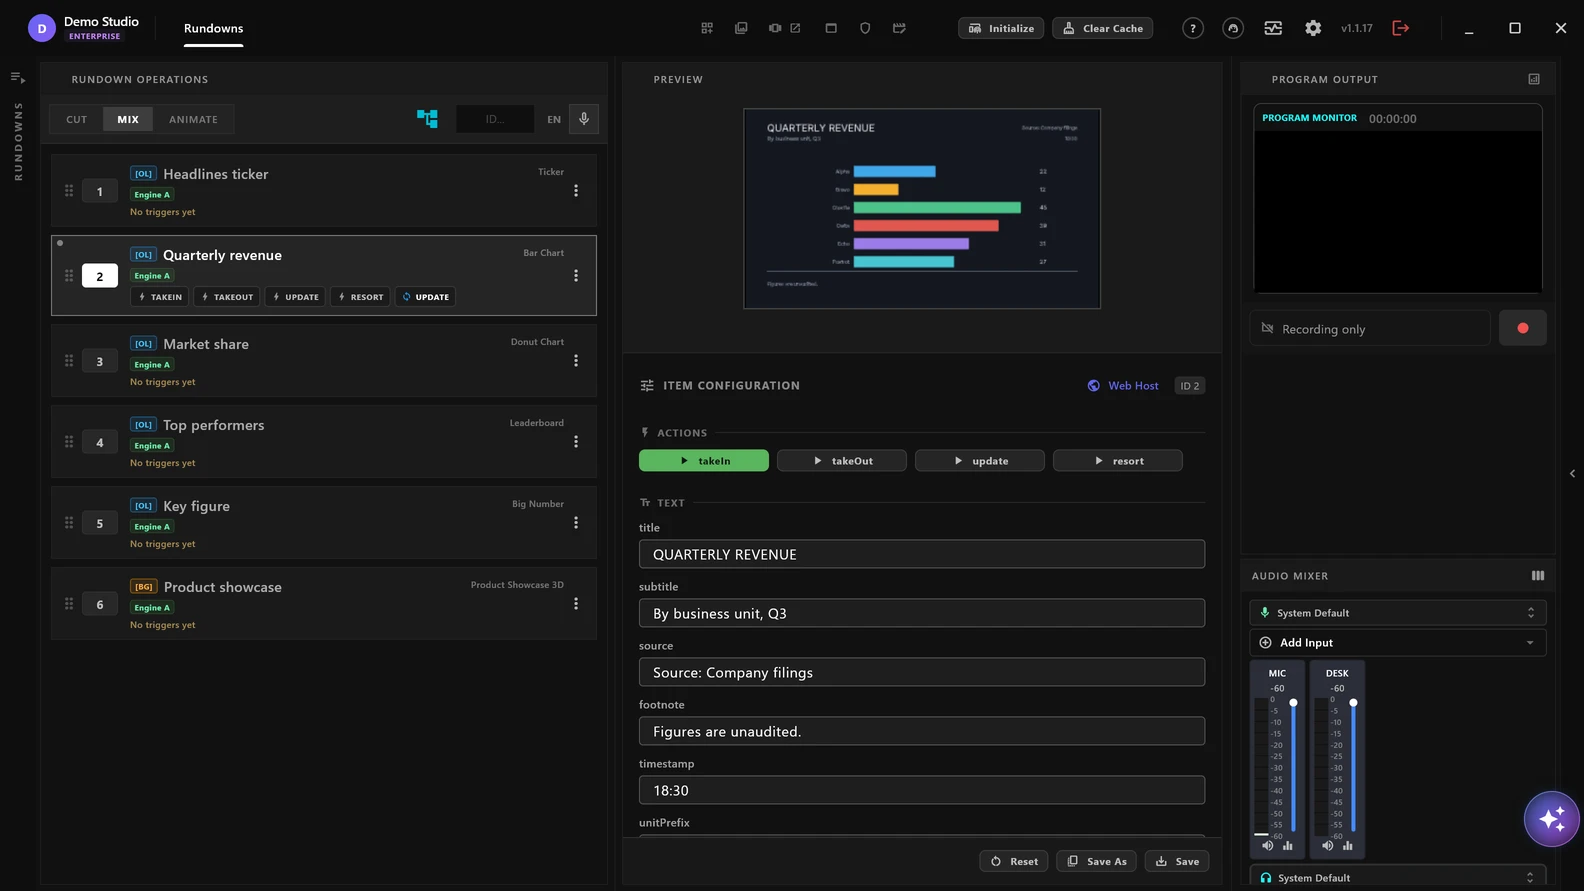
In airZ Controller, the operator adds the template to the rundown as an item. Selecting the item never puts it on air: it opens in preview and is prepared, so it goes up at once when taken. Its values appear by the names the designer gave them, ready to type into, and its triggers appear as buttons.
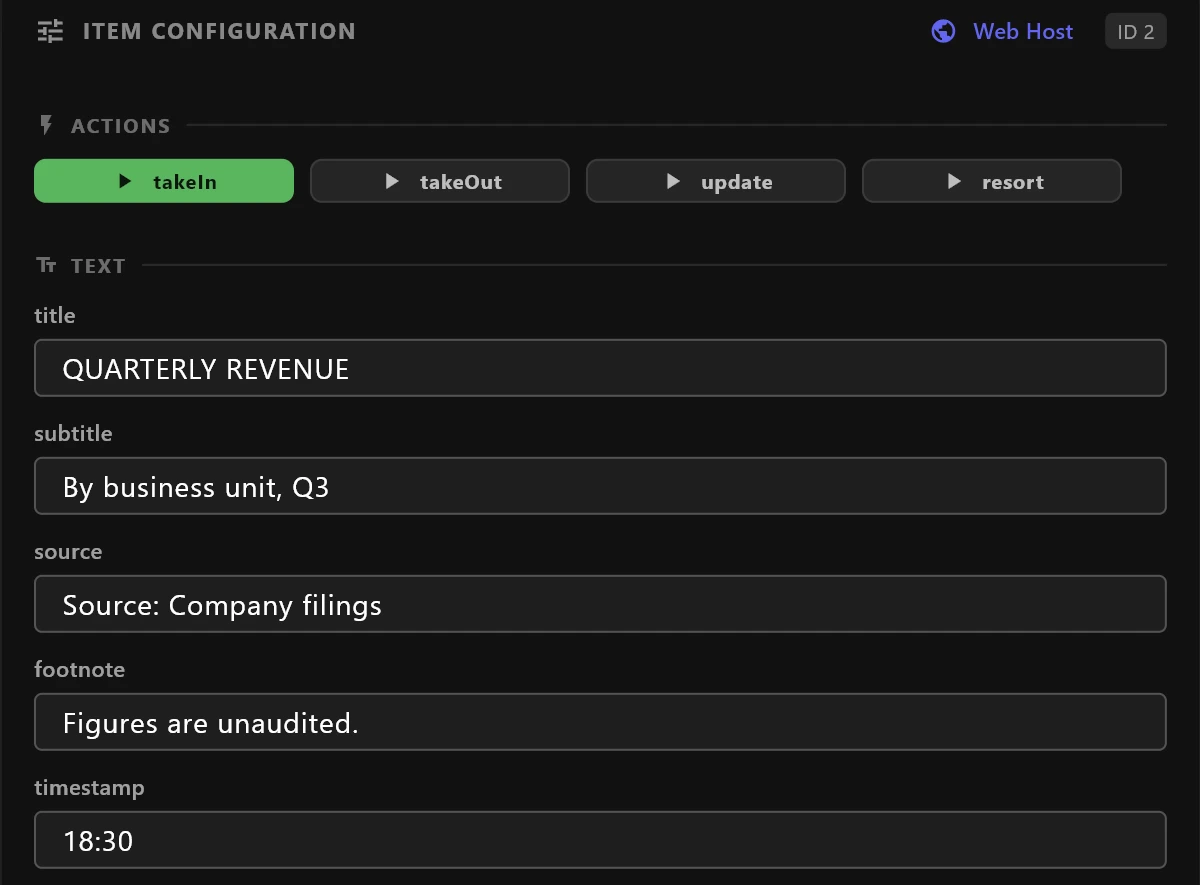
Values do not have to be typed. airZ Controller can fill them from live data, from SQL databases, spreadsheets, web APIs, RSS feeds and web pages, so scores, results and prices keep themselves up to date. A newsroom can fill them from its own rundown, through MOS or the web rundown built into airZ Controller.
4. Take it to air
When it is time, the operator presses a trigger, such as TAKEIN, and the graphic goes to air. A red edge and ON AIR mark it in the rundown.
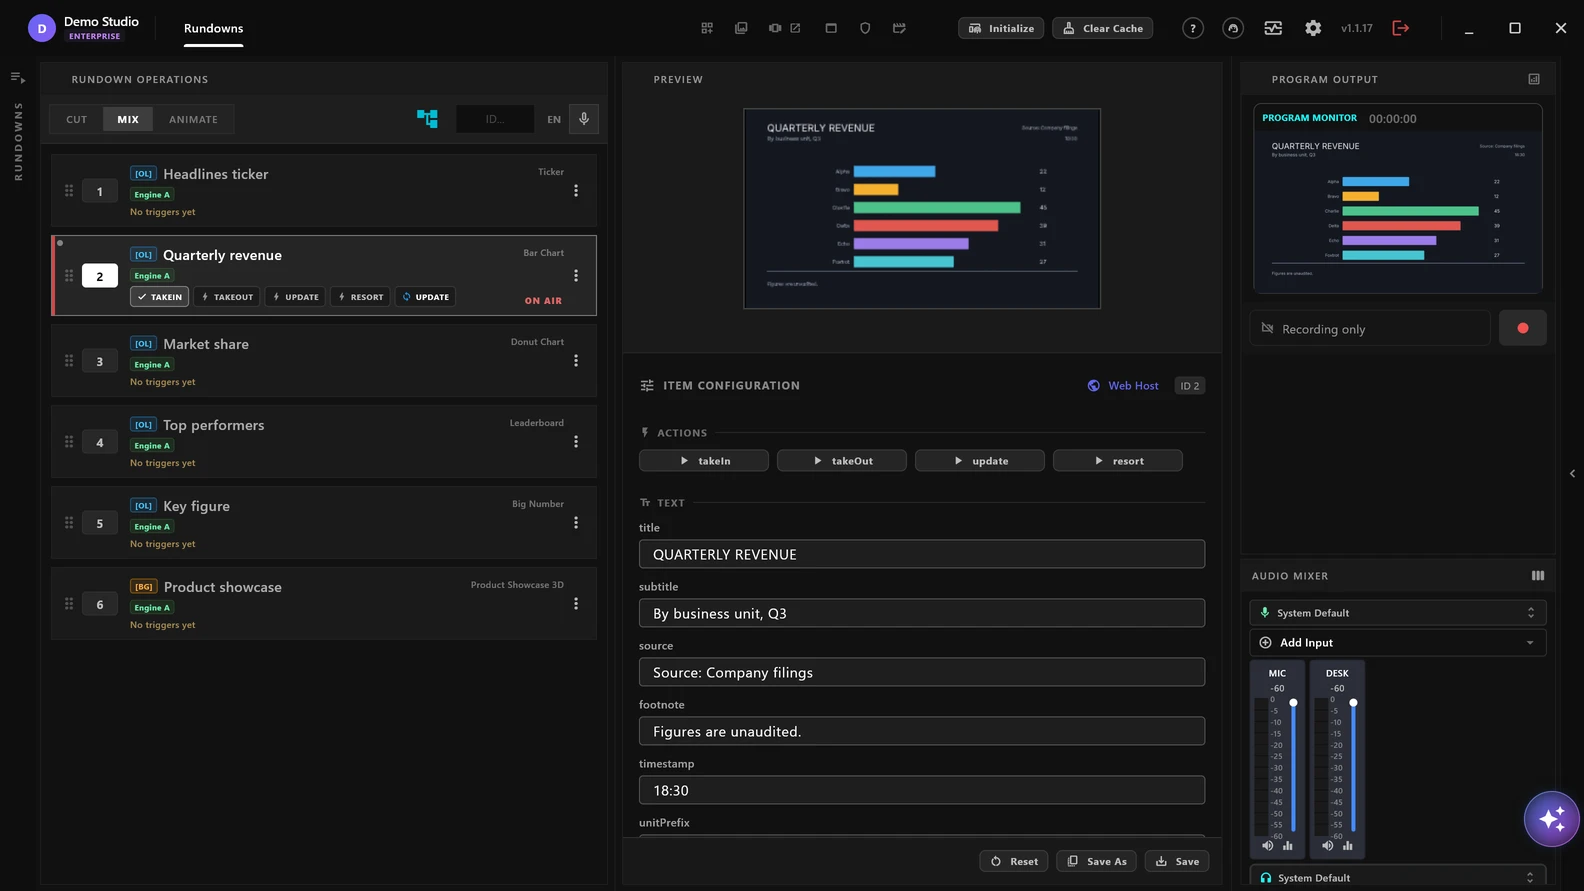
While it is up, the operator can correct a value and press UPDATE: the graphic on air changes without playing its animation again. Another trigger takes it out, or moves it to its next shot.
 5. Rendered live by airZ Engine
airZ Engine plays the same file the designer made. It renders every frame in real time at the channel's format and frame rate, and sends fill and key over SDI, or NDI with alpha, to the vision mixer. Because the graphic is rendered live rather than pre-rendered, a new value or a new version of the template reaches air straight away.
Why the path matters
- Made once. The designer's file is the file on air. Nothing is rebuilt between design and playout.
- One set of names. The values the designer named are the ones the operator, the data source and the newsroom fill.
- Safe updates. A designer's correction reaches the control room as an update, keeping the rundown as the operator set it.
- Live, not pre-rendered. New data and changes reach air within frames, not after a render.
Next in the series
Part 3 covers getting graphics into your control room: fill and key over SDI, NDI with alpha, genlock and HDR channels. Part 1, What airZ brings broadcasters, introduces the three products.
The manuals cover each step in detail: airZ Editor and airZ Controller. To see it with your own graphics, request a demonstration.